Feed: AWS Partner Network (APN) Blog.
Author: Jobin George.
By Jobin George, Sr. Partner Solutions Architect at AWS
By Rich Dill, Enterprise Solutions Architect, Partner Engineering at SnapLogic
By Dhananjay Bapat, Sr. Technical Product Marketing Manager at SnapLogic
Half of all data lake projects fail because organizations don’t have enough skilled resources who can code in Java, Scala, or Python, and do processing on large amounts of data. Additionally, skilled data engineers need a lot of time and effort to operationalize workloads that prepare, cleanse, and aggregate data to cloud data warehouses for analytics and insights.
Fully managed cloud services are rapidly enabling global enterprises to focus on strategic differentiators versus maintaining infrastructure. They do this by creating data lakes and performing big data processing in the cloud.
SnapLogic, an AWS Partner Network (APN) Advanced Technology Partner with the AWS Data & Analytics Competency, further simplifies an organization’s move to fully-managed data architecture.
SnapLogic eXtreme enables citizen integrators, those who can’t code, and data integrators to efficiently support and augment data-integration use cases by performing complex transformations on large volumes of data.
In this post, we provide step-by-step instructions to show you how to set up SnapLogic eXtreme and use Amazon EMR to do Amazon Redshift extract, transform, and load (ETL).
Using AWS CloudFormation, we create all the Amazon Web Services (AWS) resources required to complete the exercise, and guide you through to configure and complete ETL process using SnapLogic eXtreme.
We’ll also walk you through loading data from Amazon Simple Storage Service (Amazon S3) as well as an Amazon Redshift Spectrum table, and then perform transformations and load the transformed data into an Amazon Redshift table.
About SnapLogic eXtreme
Many organizations need to support use cases where there’s a need to perform complex transformations on millions of rows of data, such as:
- Claims processing for insurance companies.
- Fraud detection and risk management for financial services companies.
- Customer behavior analytics and personalization for retailers.
- Reducing healthcare costs and improving patient experience for healthcare providers.
SnapLogic eXtreme extends the unified and easy-to-use SnapLogic Intelligent Integration Platform (IIP) to build and submit powerful Spark-based pipelines visually, without writing a single line of code, to managed big data as a service (BDaaS) providers, such as Amazon EMR.
The SnapLogic visual programming interface eliminates the need for error-prone manual coding procedures, leading to quicker time-to-value without the traditional dependence on complex IT or data-engineering teams.
Unlike other data integration solutions that require integrators to have detailed knowledge on how to build and submit Spark jobs, SnapLogic eXtreme allows business users with domain expertise to perform complex processing and transformations on extremely large volumes of data within the enterprise’s existing big data infrastructure.
![SnapLogic-Amazon-EMR-1]()
Figure 1 – High-level overview of SnapLogic eXtreme platform.
As shown in Figure 1, the first step in the enterprise data journey is the Capture phase. The modern enterprise has data in many data silos, and each of these sources can provide valuable business insights even if the exact use case isn’t known ahead of time. Data is captured for both known and unknown use cases.
The Conform phase involves the processing of raw data in order to make it available to the business. Data is conformed to corporate standards ensuring governance, quality, consistency, regulatory compliance, and accuracy for downstream consumers.
The Refine phase is where the data is transformed with the eventual downstream application in mind, be that a business intelligence (BI) tool, specific application, or even a common data model for consumption by many downstream applications. Of course, this will involve aggregations, summary calculations, and more.
Finally, the Deliver phase is where the refined data is delivered to end systems, such as a cloud data warehouse or applications. SnapLogic eXtreme enhances SnapLogic’s Enterprise Integration Cloud platform to include big data processing use cases.
Security Controls and Capabilities
The SnapLogic platform complies with high security and compliance standards while providing customers with secure data integration. It supports an authentication and privilege model that allows you to grant, limit, or restrict access to components and pipelines, and it comes with easy data management and encryption capabilities.
Below are some of the key security features of SnapLogic eXtreme.
Enhanced Account Encryption: You can encrypt account credentials that access endpoints from SnapLogic using a private key/public key model that leverage AWS Key Management Service (KMS). The data is encrypted with a public key before it leaves the browser, and then decrypted with a private key on the Groundplex. The private key needs to be manually copied to each node in a Groundplex.
Cross-Account IAM Role: You can specify a cross-account identity and access management (IAM) role for an AWS account to spin up clusters on Amazon EMR without needing to share the secret and access keys of their AWS accounts.
An org admin can configure the password expiration policy, and can enforce the policy to all the users in the organization. Also, SnapLogic supports Single Sign-On (SSO) through the Security Assertion Markup Language (SAML) standard.
The SnapLogic cloud runs with a Signed TSL (SSL) certificate. The client sending the HTTP request will validate the Certificate Authority (CA) certificate to verify its validity. For additional security, the org admin can configure an IP address trusted to enforce access control for nodes in a Snaplex that connects to the SnapLogic control plane.
To further enhance the SnapLogic platform security, you can also disable external process (like popen) creation on Cloudplex via the Script Snap or a custom Snap. Additionally, you can also disable read/write access to files in the Snaplex installation folder while executing pipelines.
Using eXtreme to Visualize EMR Spark Pipelines for Redshift ETL
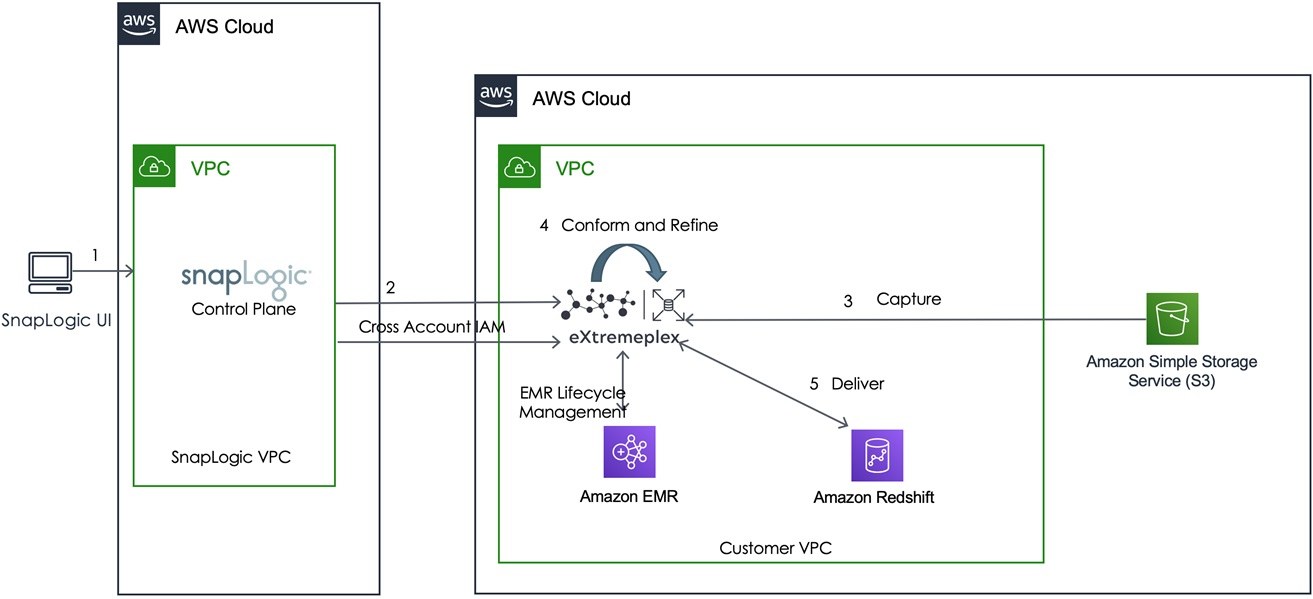
The diagram in Figure 2 illustrates the architecture of how SnapLogic eXtreme helps you create visual pipelines to transform and load data into Amazon Redshift using Apache Spark on Amazon EMR.
We have two data sources; one resides in Amazon S3 and the other in Spectrum table. The target is Amazon Redshift internal tables.
![SnapLogic-Amazon-EMR-2]()
Figure 2 – Architectural overview of SnapLogic eXtreme on AWS.
Prerequisites
Here is the minimum required setup to complete the hands-on tutorial.
- Before starting this tutorial, you need to have an AWS account. In this exercise, you configure the required AWS resources using AWS CloudFormation in the us-east-1 region. If you haven’t signed up, complete the following tasks:
- Active SnapLogic account with eXtreme enabled. If you don’t have an account, sign up for a trial and activate eXtreme in your account.
Create Amazon Redshift Cluster and Cross-Account Role
We have used the following AWS CloudFormation template to create a single node Amazon Redshift instance running on dc2.large to be used as the target in the below exercise.
This will also create three Amazon S3 buckets required for our eXtreme pipelines. It will also create a few IAM roles, including cross-account trust IAM roles required for eXtreme to spin up resources in your AWS account.
Click Launch Stack to initiate CloudFormation stack creation in the us-east-1 region.
![Launch Stack]()
On the Create Stack page, acknowledge the resource Capabilities and click Create Stack. Wait for the stack creation to complete, which can take up to 10 minutes to complete.
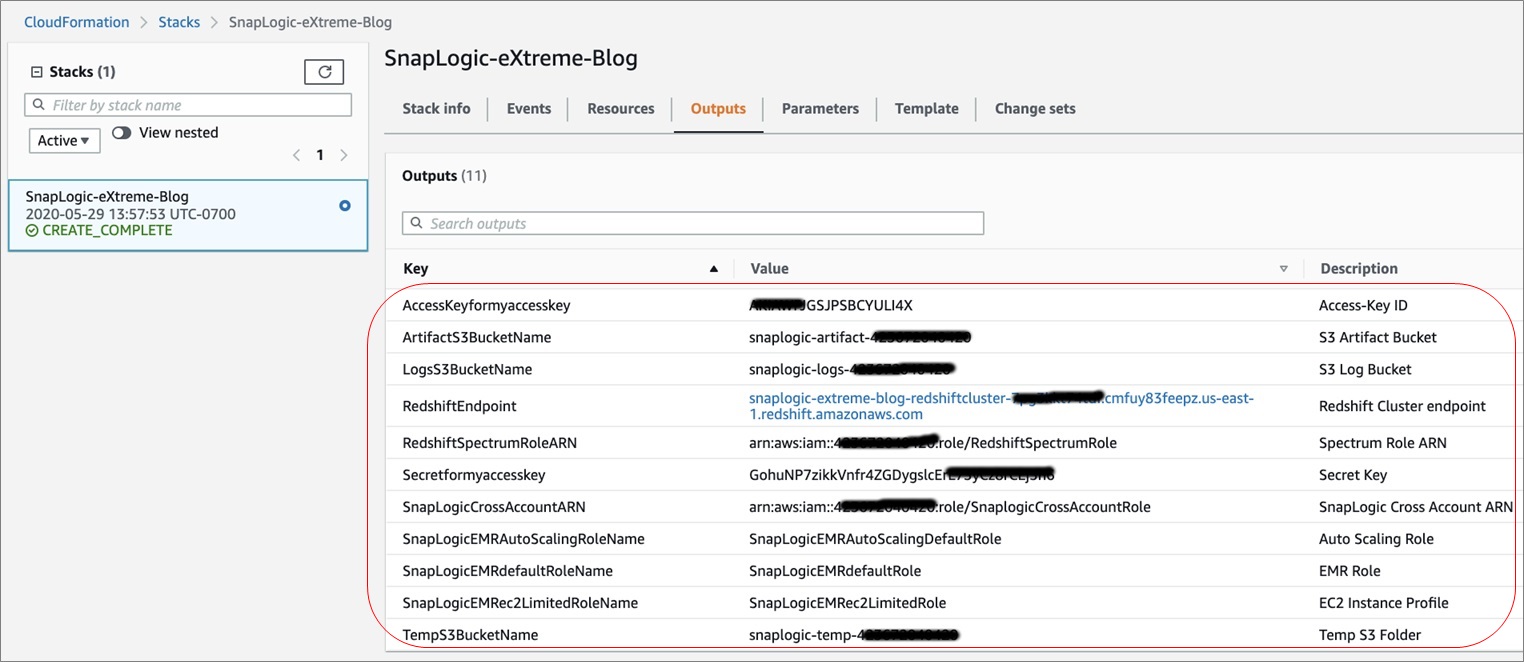
Once this is done, check the Stack Output tab and note down all of the items. We’ll require them for future steps.
![SnapLogic-Amazon-EMR-3.1]()
You may verify the Amazon Redshift cluster, IAM roles, and S3 bucket location created as part of this CloudFormation deployment using the AWS console.
Create Spectrum Schema and Source Table
A single node Amazon Redshift cluster is created as part of the CloudFormation deployment. Connect to the cluster in order to create the source Spectrum table pointing towards a dataset stored in Amazon S3.
Connect to Redshift Query Editor from the AWS console to create the required Amazon Redshift table. Navigate to Services > Redshift > Query Editor and provide the following credentials to connect to it:
- Cluster: <Select the cluster with end point noted from the CloudFormation output >
- Database Name: snaplogic
- Database User: snapuser
- Database Password: Snapuser01
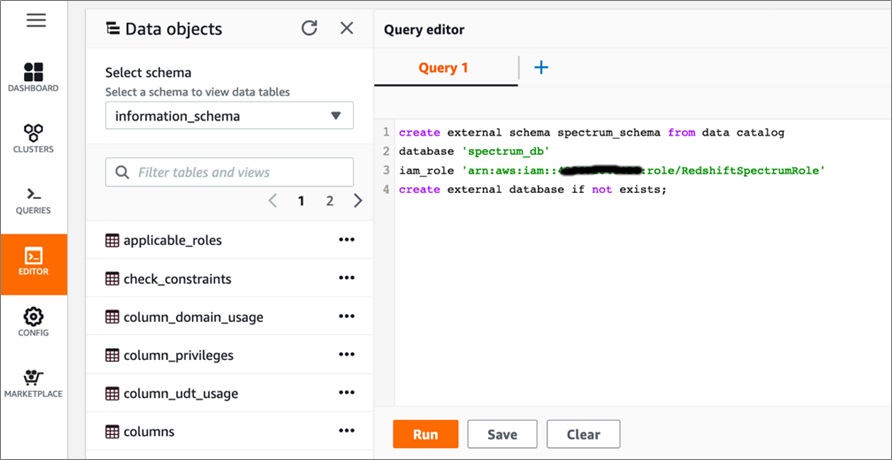
Once on the query editor page, execute the following DDL command to create an external schema named spectrum_schema. Use the value of RedshiftSpectrumRoleARN noted from the CloudFormation output within single quotes below:
create external schema spectrum_schema from data catalog
database ‘spectrum_db’
iam_role ‘<RedshiftSpectrumRoleARN>’
create external database if not exists;
![SnapLogic-Amazon-EMR-4]()
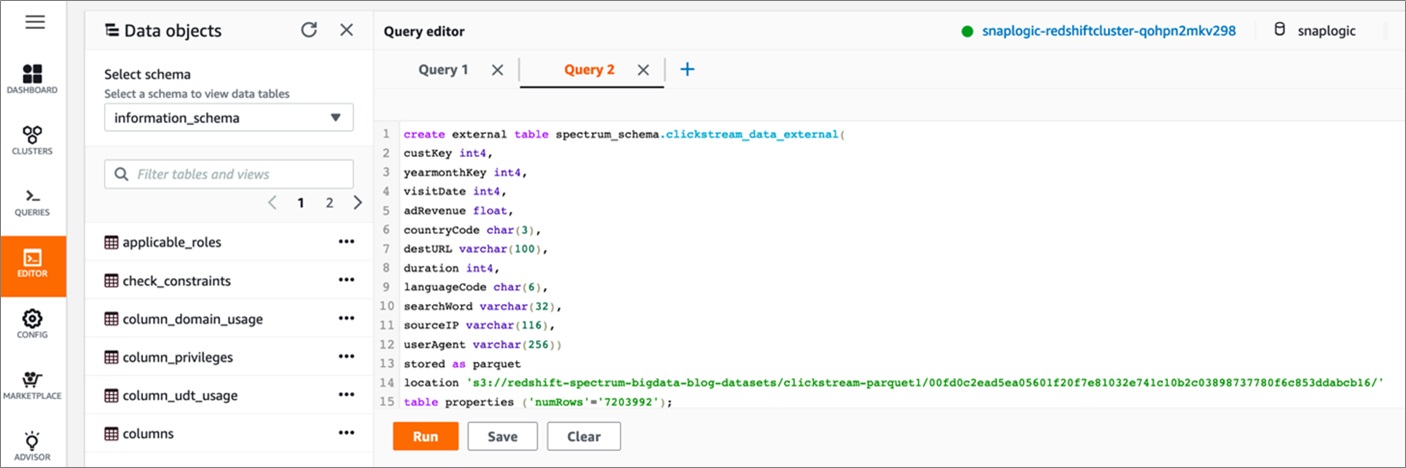
Once the schema is created, execute the following DDL command to create a Spectrum table pointing to data stored in S3 on a separate query editor tab:
create external table spectrum_schema.clickstream_data_external(
custKey int4, yearmonthKey int4, visitDate int4, adRevenue float, countryCode char(3), destURL varchar(100), duration int4, languageCode char(6), searchWord varchar(32), sourceIP varchar(116), userAgent varchar(256)) stored as parquet location 's3://redshift-spectrum-bigdata-blog-datasets/clickstream-parquet1/00fd0c2ead5ea05601f20f7e81032e741c10b2c03898737780f6c853ddabcb16/'
table properties ('numRows'='7203992');
![SnapLogic-Amazon-EMR-5]()
Configure SnapLogic eXtremeplex on Amazon EMR
Once the previous section is completed, you can configure eXtremeplex now. All the prerequisites for eXtremeplex have been created as part of the CloudFormation deployment.
The following steps take you through how to establish connectivity. Visit the eXtreme documentation to learn more about what permissions and IAM roles were created.
Now, log in to the SnapLogic Control Plane User Interface using your account credentials.
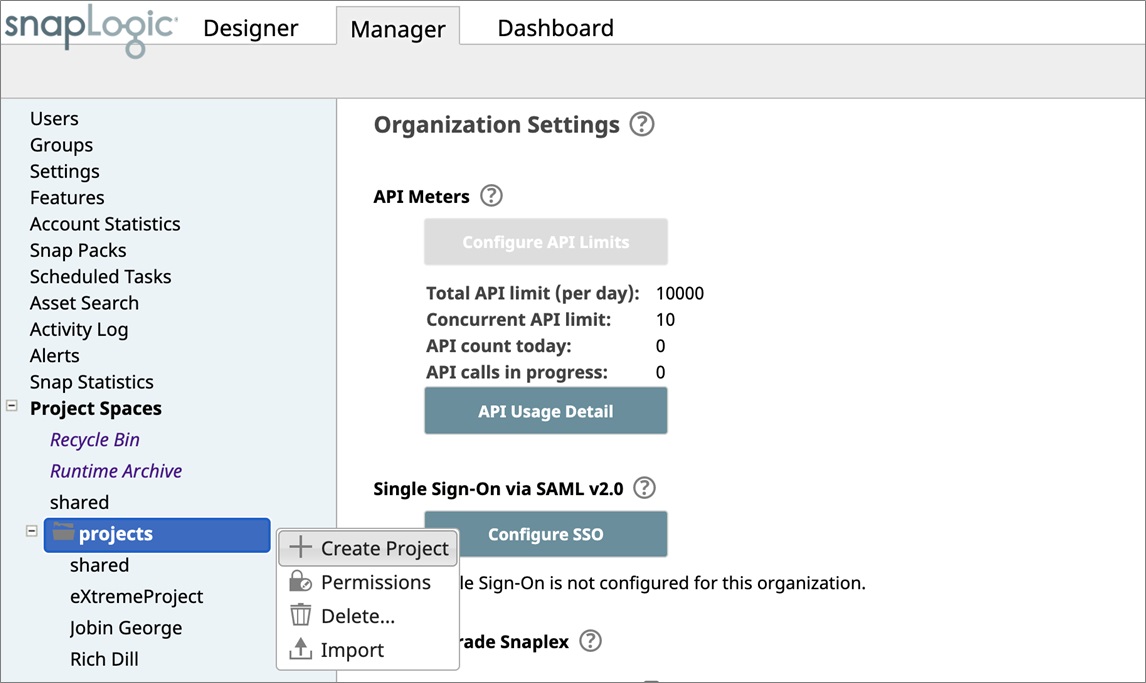
Next, navigate to the SnapLogic Manager tab, and on the left panel towards the bottom you will find projects. Click on the downward arrow to display options and click Create Project. Let’s name our project eXtreme-APN-Blog.
![SnapLogic-Amazon-EMR-6]()
Click on the project you just created and navigate to the Account tab. Click the ‘+’ sign to add an account, and from the list select Extreme > AWS IAM Role Account.
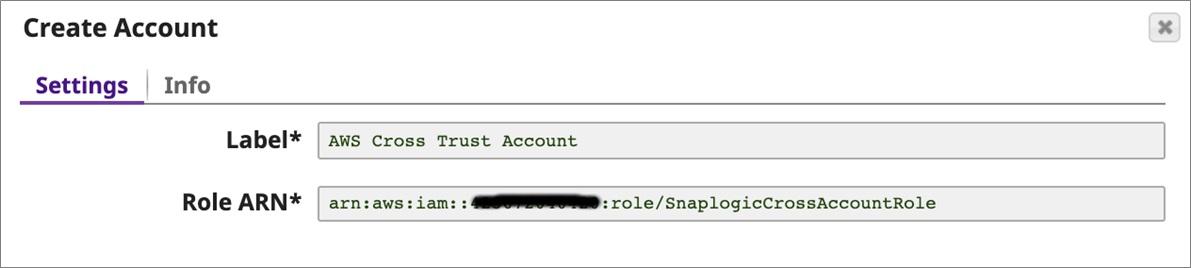
On the Create Account pop-up, provide a name for the account, such as AWS Cross Trust Account, and provide <SnapLogicCrossAccountARN> from the CloudFormation output page.
Click Validate and then Apply to add the account.
![SnapLogic-Amazon-EMR-7]()
While on the Account tab, click the ‘+’ sign again to add another account. From the list, select Extreme Redshift > Redshift Database Account.
On the Create Account pop-up, provide the following details:
- Label: Redshift Cluster
- Hostname: <RedshiftEndpoint> from CloudFormation output page
- Port Number: 5439
- Database Name: snaplogic
- Username: snapuser
- Password: Snapuser01
Once updated, click Apply and save the details you entered.
Now, navigate to the Snaplexes tab, and click the ‘+’ sign to add a Snaplex of type eXtremeplex. In the pop-up window, provide these details:
- Snaplex Type: eXtremeplex
- Name: Redshift_ETL_On_EMR
- Environment: Dev
- Account Type: AWS IAM Role Account
- Region: us-east-1 [select Account created above from Account Tab first]
- Instance Type: m4.4xlarge
- Market: On Demand
- S3 Log Bucket: <LogsS3BucketName> from CloudFormation output page
- S3 Artifact Bucket: <ArtifactS3BucketName> from CloudFormation output page
- EC2 Instance Profile: SnapLogicEMREC2DefaultRole
- EMR Role: SnapLogicEMRdefaultRole
Before saving, navigate to the Advanced tab to configure Auto Scaling Capabilities. Provide the following configurations and leave everything else to default:
- Auto Scaling: <Checked>
- Maximum Cluster Size: 5
- Auto Scaling Role: SnapLogicEMRAutoScalingDefaultRole
Click Create to create the eXtremeplex. Now, you have all the configurations required for executing an eXtreme pipeline. Let’s build some!
Import and Configure eXtremeplex Pipeline into SnapLogic Designer
Once the eXtreme environment is configured, you can starting creating the pipeline, but here you may use an already created pipeline. Here’s a link for you to download a pre-created pipeline S3_to_Redshift.slp to your local system.
The pipeline you just downloaded is designed to load raw files in parquet format from Amazon S3 to an Amazon Redshift table, as well as data already in an Amazon Redshift Spectrum table into an Amazon Redshift internal table.
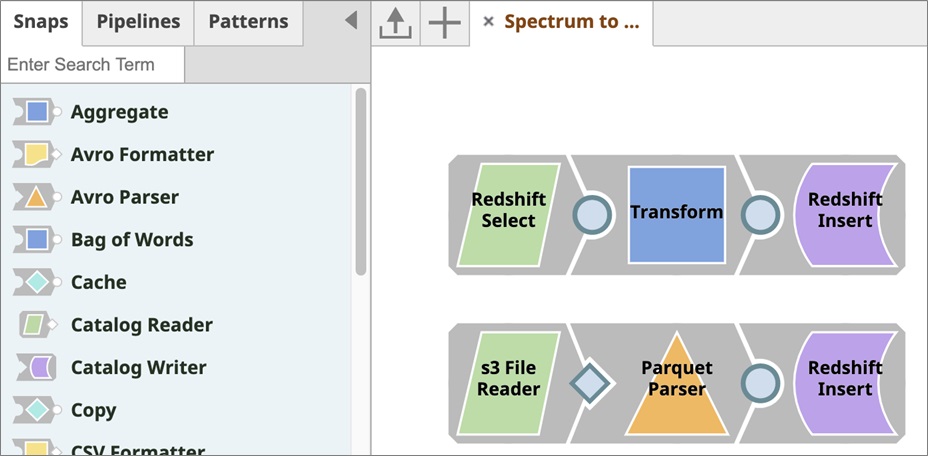
This pipeline contains only six snaps, including a Redshift Select snap, transform snap, Redshift insert snap and File Reader snap for reading files from S3 and Amazon Redshift Spectrum and insert it to Amazon Redshift internal tables.
Before you begin, navigate to the SnapLogic Designer tab, and on the top left side you will find the Import a Pipeline icon. Click it to import a new pipeline.
When prompted, select the saved file S3_to_Redshift.slp, and in the settings prompted make sure you choose eXtreme-APN-Blog which you created in the previous section.
Click Save to load it on the designer. Now, you can see the pipelines as below:
![SnapLogic-Amazon-EMR-9]()
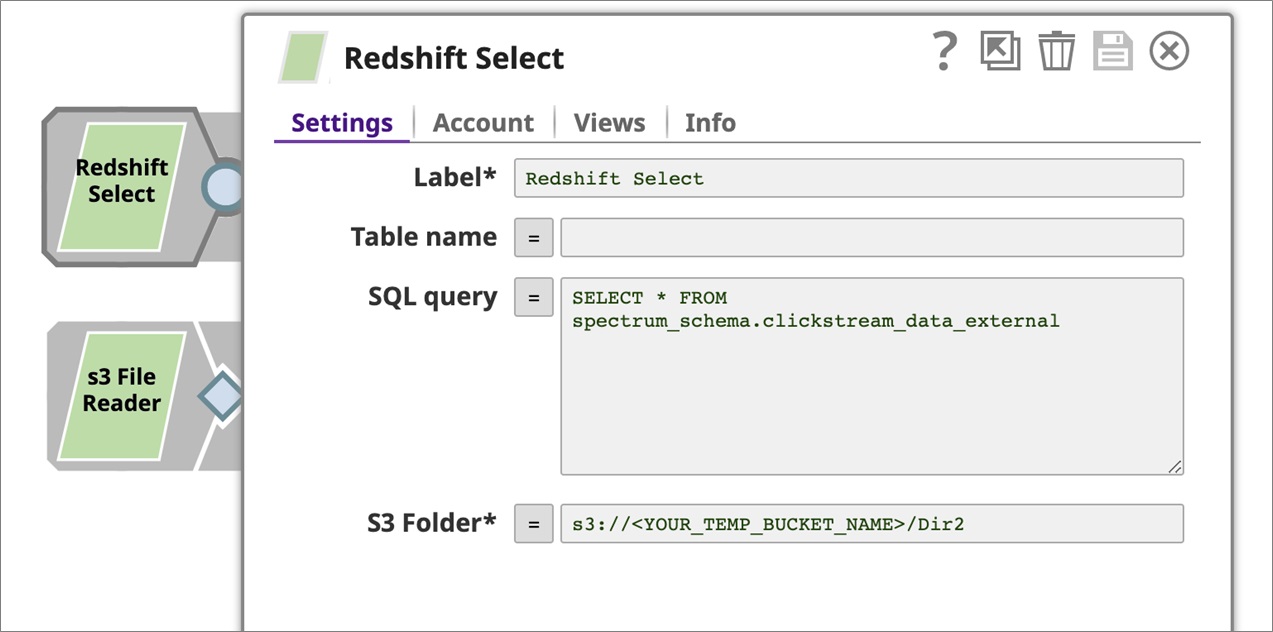
Click on the Redshift Select snap and make sure you update TempS3BucketName noted from the CloudFormation output page in the S3 Folder section.
Navigate to the Account tab and select the Redshift Cluster account you created in the previous section. Click Save to proceed. Leave other configurations as is.
![SnapLogic-Amazon-EMR-10]()
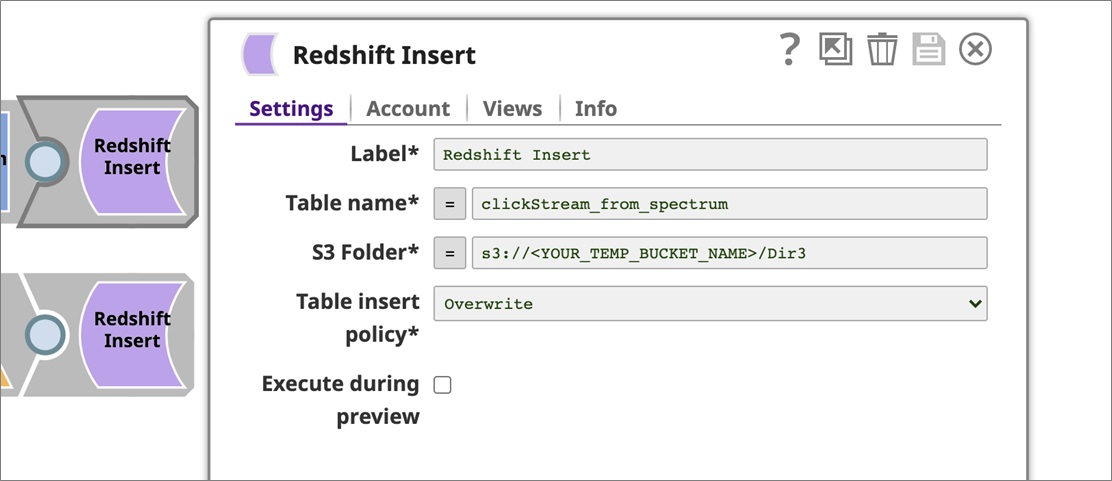
Repeat the same steps for both Redshift Insert snaps as well. Make sure you update the TempS3BucketName noted from the CloudFormation output page in the S3 Folder section.
Navigate to the Account tab and select the Redshift Cluster account you created in the previous section. Click Save to proceed.
![SnapLogic-Amazon-EMR-11]()
Next, let’s configure the S3 File Reader snap. Click on the snap, navigate to the Accounts tab, and click the Add Account button.
In the pop-up, select the location as projects/eXtreme-APN-Blog and choose account type to create as “AWS Account” and click OK.
When asked, provide a label and update the Access-Key ID and Secret Key noted from the CloudFormation output page. Click Apply.
Now, you are ready to execute your pipeline. Everything else required to read data from Amazon S3, Redshift Spectrum, and target table details for the Amazon Redshift table are configured in the pipeline already.
Click and open the Transform snap and look how visitDate field from an integer type in yyyyMMdd format is converted into date type in yyyy-MM-dd format.
Running an eXtremeplex Pipeline on Amazon EMR
Now that the pipeline is uploaded and configured, it’s time to run it and load data into Amazon Redshift.
Once the pipeline is configured, click on Execute Pipeline to start the pipeline execution. Make sure you have selected the Redshift_ETL_On_EMR snaplex you created in the previous section.
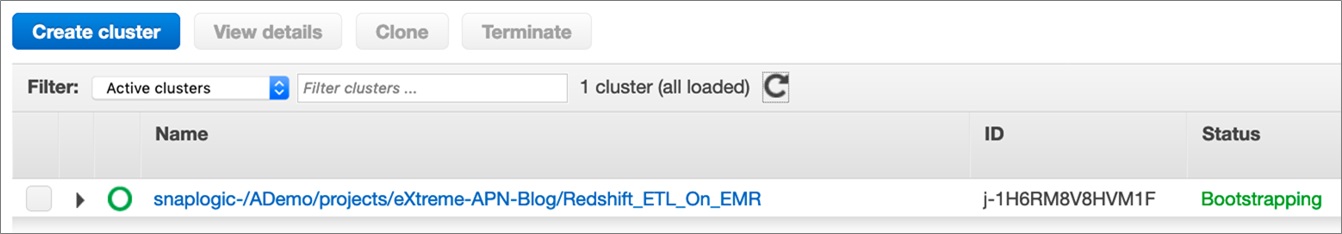
Once you start the pipeline, you may navigate to the Amazon EMR console to see the EMR spark cluster starting up.
![SnapLogic-Amazon-EMR-12]()
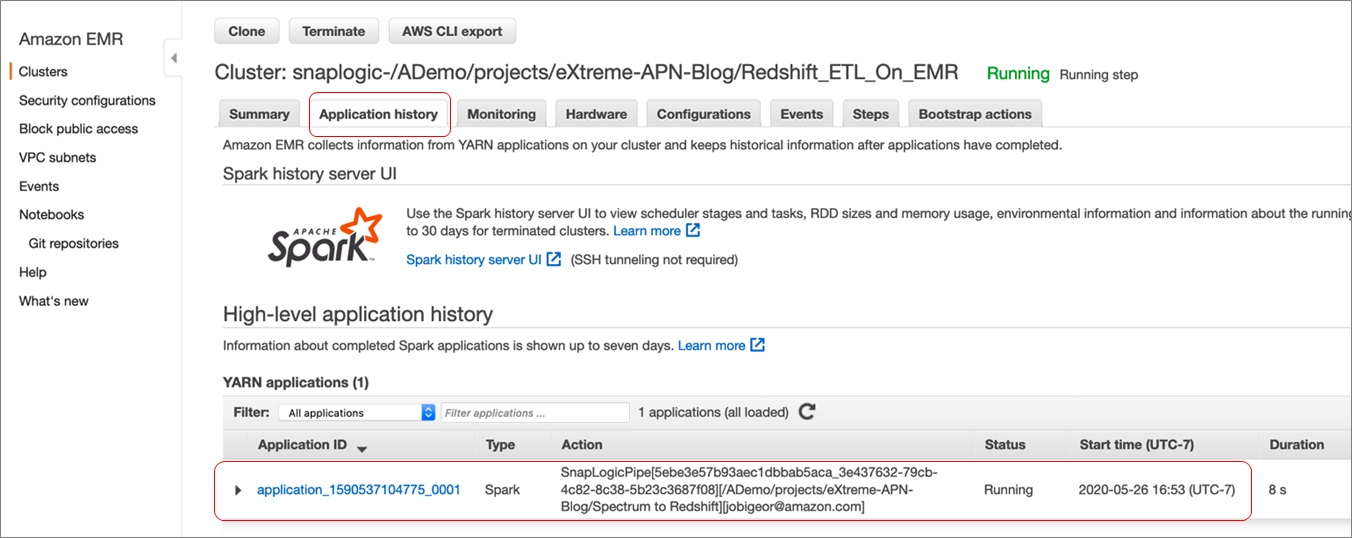
It may take a few minutes to bootstrap the cluster. Once it’s started, click on the cluster and select the Application History tab. You will find the pipeline being executed.
Note that only the first execution takes time to spin the cluster; based on your configuration, the Amazon EMR cluster will continue to run for a period of time and then shut down after a period of time post no activity.
![SnapLogic-Amazon-EMR-13]()
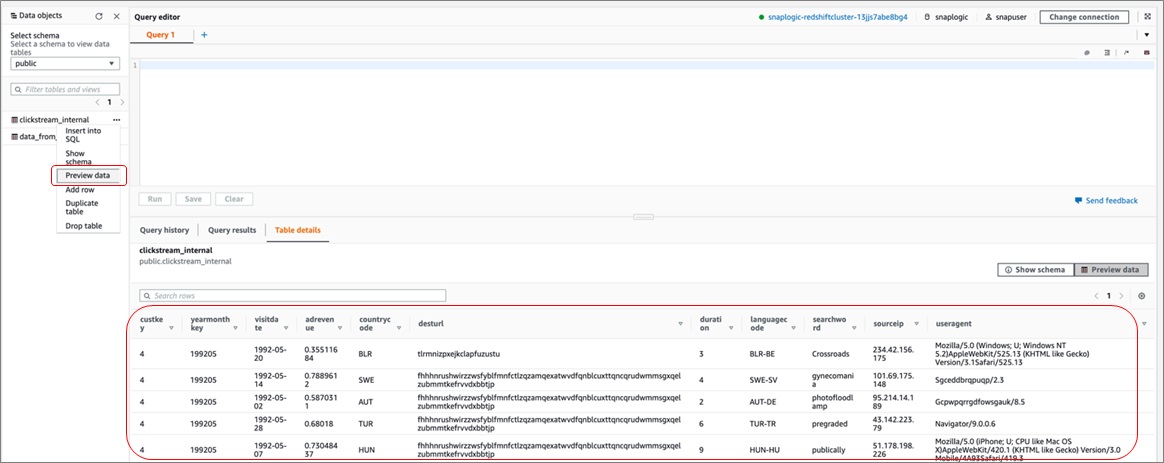
This application may take a few minutes to complete, as well. Once completed, navigate to Redshift Query Editor from the AWS console to verify the Amazon Redshift tables were created.
In the public schema, you’ll notice the new tables are created in the Data Object panel on the left. Right-click and select Preview Data and you’ll see the data being populated.
![SnapLogic-Amazon-EMR-14]()
You may also simply run the below count query. You should see approximately ~7.2 million records loaded into both the Amazon Redshift tables.
Select count(*) from public.clickstream_internal;
select count(*) from public.data_from_s3;
Best Practices While Using SnapLogic eXtreme
To optimize the cost for running an Amazon EMR cluster, we recommend you terminate an idle cluster after 30 minutes. You can specify a timeout while configuring the cluster template.
Do not use colon ( : ) in Amazon S3 and Hadoop file or directory names, as the colon is interpreted as a URI separator, giving this error — Relative path in absolute URI: <filewithcolon>.
To optimize the cost and time in validating pipelines each time you modify it, ensure you disable the Auto Validate checkbox in the user Settings dialog.
For the Spark SQL 2.x CSV Parser Snap, the maximum number of columns is 20480 per row. However, system resource limitations may cause the pipeline to fail validation before the maximum number is reached.
Regarding performance optimization, executing eXtreme pipelines works most efficiently by setting the Spark parameter spark.sql.files.maxPartitionBytes with a value 128MB, which is the Spark default setting.
Because this setting value performs better for most of the use cases, we recommend you do not change it. In SnapLogic Designer, always specify in the Pipeline parameters: spark_sql_files_maxPartitionBytes.
Amazon EMR clusters give multiple configuration options. Based on our tests, for a 100GB dataset, the following cluster configuration performs better for most of the use cases: m4.4xlarge or r4.4xlarge with 8 nodes.
Accordingly, in terms of scaling for larger datasets, customers should scale the number of nodes in their cluster depending on the increase in dataset size. For example, if the dataset size is increased to 200GB, you should double the cluster size to 16 nodes.
When reading or writing your Spark jobs to the Snowflake data warehouse, we recommend you follow these best practices:
- Use the X-Small size warehouse for regular purposes.
- Use a Large/X-Large size warehouse for faster execution of pipelines that ingest data sets larger than 500GB.
- Use one pipeline per warehouse at any given time to minimize the execution time.
Clean Up
When you finish, also remember to clean up all of other AWS resources you created using AWS CloudFormation. Use the CloudFormation console or AWS Command Line Interface (CLI) to delete the stack named SnapLogic-eXtreme-Blog.
Note that when you delete the stack, created Amazon S3 buckets will be retained by default. You will have to manually empty and delete those S3 buckets.
Conclusion
In this post, you learned how to set up eXtremeplex to connect your AWS environment and execute Amazon Redshift ETL workloads using Spark pipelines from SnapLogic User Interface, and to run it on transient EMR Spark cluster.
We imported a SnapLogic eXtreme pipeline designed to use data sets residing in Amazon S3, as well as in a Redshift Spectrum table as source, while the target is a Redshift internal table. We also demonstrated how to do transformation before we load the data into Amazon Redshift.
SnapLogic eXtreme extends the unified and easy-to-use SnapLogic Intelligent Integration Platform (IIP) to build and submit powerful Spark-based pipelines visually, without writing a single line of code to managed big data as a service (BDaaS) providers, such as Amazon EMR.
To learn more about SnapLogic, get started with the AWS Quick Start: Data Lake with SnapLogic on AWS.
.
![SnapLogic-APN-Blog-CTA-2]()
.
SnapLogic – APN Partner Spotlight
SnapLogic is an AWS Competency Partner. Through its visual, automated approach to integration, SnapLogic uniquely empowers business and IT users to accelerate integration needs for applications, data warehouse, big data, and analytics initiatives.
Contact SnapLogic | Solution Overview
*Already worked with SnapLogic? Rate this Partner
*To review an APN Partner, you must be an AWS customer that has worked with them directly on a project.


 On Monday, July 13, 2020, Oracle released MySQL 8.0.21. This release contained a few new changes that cause issues with Percona XtraBackup.


 I got this question on the
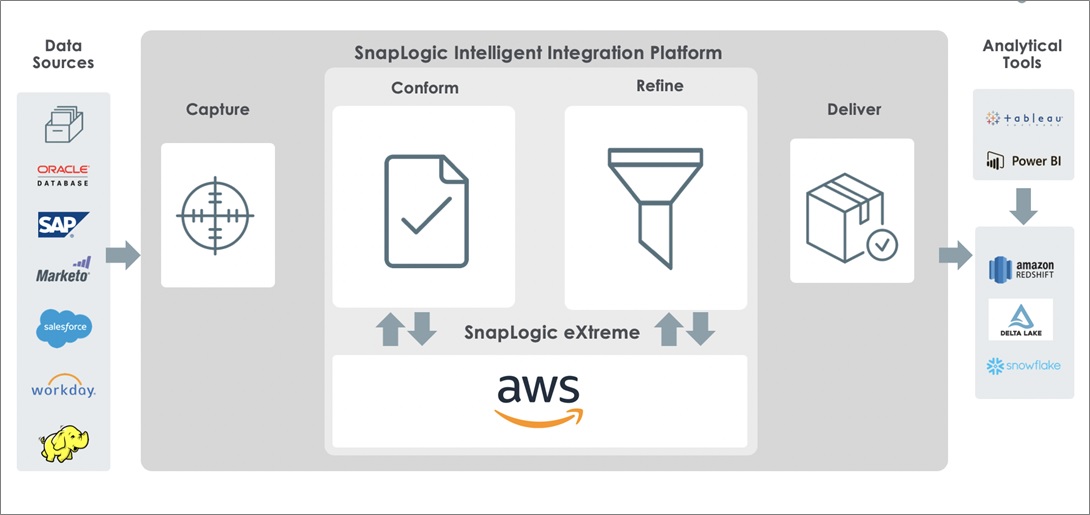


 Suthan Phillips is a big data architect at AWS. He works with customers to provide them architectural guidance and helps them achieve performance enhancements for complex applications on Amazon EMR. In his spare time, he enjoys hiking and exploring the Pacific Northwest.
 Chao Gao is a Software Development Engineer at Amazon EMR. He mainly works on Apache Hive project at EMR, and has some in-depth knowledge of distributed database and database internals. In his spare time, he enjoys making roadtrips, visiting all the national parks and traveling around the world.


