Quantcast
Channel: DDL – Cloud Data Architect
Viewing all 275 articles
Browse latest View live

Big SQL Automatic Catalog Synchronization (Part 1 – Introduction)

$
0
0

Feed: Hadoop Dev.
Author: Shay Roe.

Introduction
Automatic synchronization of the Hive metastore and Big SQL catalog was introduced in Big SQL 4.2 and is a significant enhancement to how Big SQL manages its catalog tables. With this feature enabled, Big SQL will automatically synchronize Hive metastore changes into the Big SQL catalog, so that, any Hive DDL operations (CREATE, ALTER, DROP), will be automatically reflected in the Big SQL catalog. If a new table is created in Hive, for example, that table will automatically be available in Big SQL.

This blog is the first in a three-part series that will outline all you need to know to start working with Big SQL’s Automatic Catalog Synchronization (Auto-Sync). Future blogs in the series will provide more detailed information on the feature’s architecture, configuration options and problem determination. This first blog is an introduction to Auto-Sync, discussing its significance, the problem it addresses and how it can be enabled/disabled.

Background
Big SQL and Hive share table metadata via the Hive metastore. By doing this, Big SQL can work with tables created in Hive and Hive can work with tables created in Big SQL. Big SQL also stores metadata locally in the Big SQL catalog, for ease of access and to facilitate query execution.

Generally the Big SQL catalog and the Hive metastore are in sync, and things look something like what we have in Figure 1.

Auto_Synchronization_insync
Fig.1 – Big SQL catalog and the Hive metastore in sync.

Under some circumstances, however, we may end up in an out-of-sync state that looks more like what we have in Figure 2. Here, due to DDL changes executed in Hive, Big SQL and Hive have a different view of the table definitions.

Auto_Synchronization_outofsync
Fig.2 – Big SQL catalog and the Hive metastore out of sync.

How Might This Happen?
A metadata mismatch is the result of a Hive metastore change occurring outside of Big SQL’s control. That is, a metadata update via Hive that is yet to be picked up by Big SQL. Big SQL is unaware of these DDL operations and therefore the catalog potentially falls out of sync with the Hive metastore.

For example say we have a table called “mybigtable” that was originally created in Big SQL with all Hive metadata and Big SQL catalog data in sync and as expected. Later, a user, while using Hive, adds a new integer column called ‘newcol‘ to the table.

At this point, the table definition in Hive now looks like this:
Auto_Synchronization_hiveDescribe

However, without Auto-Sync enabled, the same table as far as Big SQL is concerned, still looks like this:
Auto_Synchronization_bigsqlDescribec

Big SQL Solution Prior to 4.2 Release – HCAT_SYNC_OBJECTS
Prior to version 4.2, Big SQL does provide a solution for this problem, however manual intervention is required. The user can rectify this metadata inconsistency by manually executing the HCAT_SYNC_OBJECTS stored procedure.

Big SQL 4.2 Solution – Auto-Sync
Since Big SQL 4.2, Auto-Sync enables the Big SQL catalog to be kept up to date with the Hive metastore automatically. This feature can be enabled/disabled through the Ambari GUI (details below). When enabled, any DDL changes reflected in the Hive metastore will be picked up and automatically synced with the Big SQL catalog. In later versions of Big SQL, Auto-Sync is enabled by default.

Enabling/Disabling Auto-Sync
Auto-Sync can be enabled/disabled via the Ambari GUI:

    Go To:
    “BigInsights – BigSQL” Service
    “Service Actions” drop down menu
    EnableAutoHcatSync or Enable Metadata Sync /
    DisableAutoHcatSync or Disable Metadata Sync ( Shown below in Figure 3 )
Auto_Synchronization_EnableDisable
Fig.3 – Enabling/Disabling Big SQL Auto-Sync in Ambari.

It’s possible that a user will experience a lag of up to five minutes from the time when Auto-Sync is (re)enabled (or when Big SQL is restarted) to when it first processes DDL changes from Hive. After this initial lag, however, Big SQL will quickly process any DDL changes from the Hive metastore.

Depending on the version of Big SQL installed, automatic synchronization will either happen at a fixed 60 second interval or, for later versions, at an interval set by bigsql.catalog.sync.sleep (default is 30 seconds). We show how to configure this parameter in part 2 of this blog series.

Summary
In this blog we introduced Big SQL’s Automatic Synchronization (Auto-Sync). This is a Big SQL feature that provides automatic synchronization of table metadata between the Hive metastore and the Big SQL catalog. We outlined the significance of this feature and the problem it solves. We also looked at how to get started using this feature by enabling/disabling via Ambari.

In part 2 of this blog series we’ll take a closer look at the architecture of Auto-Sync, detailing how Big SQL provides this metadata synchronization solution.

Additional Information


Big SQL Automatic Catalog Synchronization (Part 2 – Architecture)

$
0
0

Feed: Hadoop Dev.
Author: Shay Roe.

Introduction
This blog is the second installment in a series that will outline all you need to know to start working with Big SQL’s Automatic Catalog Synchronization (Auto-Sync). In part 1 we provided an introduction to Auto-Sync, discussing it’s significance, the problem it addresses and how it can be enabled/disabled via the Ambari GUI. In this blog we’ll provide more details on the feature’s architecture and configuration options.

Architecture
At a high level and as shown in Figure 1, Big SQL’s Auto-Sync feature can be thought of as containing two core components:

    1. Event-File Generation
    2. Event-File Processing
AutoHcatSync_Arch
Fig.1 – Big SQL Auto-Sync Architecture

1. Event-File Generation
For every DDL statement executed that results in an update to the Hive metastore, the relevant DDL event information is serialized and a JSON formatted file is created and stored in a predetermined location on HDFS. This HDFS location is known as the events-directory and by default is: “/user/bigsql/sync”.

Figure 2 shows an example of a DDL event written to a JSON event-file. This event-file is associated with an ALTER table statement executed against the table, mybigtable. In fact, this is the file generated as a result of our example in part 1, where a new column was added, via Hive, to our existing table, ‘mybigtable’.

AutoHcatSync_EventFile
Fig.2 – Example of an Auto-Sync event-file

For any DDL statement executed in Hive (CREATE, DROP, ALTER) and causing a change in the Hive metastore, a new JSON event-file, similar to the one shown in Figure 2, is written to the events-directory on HDFS. For example, if there are 10 DDL statements executed in Hive, we get 10 corresponding event-files in the events-directory, ready to be processed by Big SQL.

2. Event-File Processing
Once there are files present in the events-directory, they will need to be processed in some way. Big SQL automatically parses through all files in this pre-configured directory on HDFS every ‘n’ seconds, processing any associated DDL events and updating the Big SQL catalog where necessary to reflect the relevant metadata changes. (Where ‘n’ is the time, in seconds, Big SQL waits between processing event-files – see Configuration section below for more details). Once a DDL event has been successfully processed, the associated event-file is removed from the events-directory.

Configuration
There are a couple of Auto-Sync related configuration parameters that you should be aware of. While, generally speaking, there is usually no need to modify these, it is possible to change their values if necessary.

  • The bigsql.catalog.sync.events Parameter
    This is the HDFS directory that event-files are written to and processed from. This parameter is accessible via Ambari (as shown in Figure 3), under:

    Hive - Configs - Advanced - Custom hive-site - bigsql.catalog.sync.events

    AutoHcatSync_Configurations
    Fig.3 – bigsql.catalog.sync.events Parameter
  • The bigsql.catalog.sync.sleep Parameter
    This parameter is available in more recent versions of Big SQL. It determines the duration (in seconds) Big SQL will wait before re-processing event-files from the events-directory. The default for this parameter is 30 seconds and is configurable in Ambari (as shown in Figure 3), under:

    Hive – Configs – Advanced – Custom hive-site – bigsql.catalog.sync.sleep.

    The valid values for bigsql.catalog.sync.sleep are between 1 and 60 (seconds). If a value less than 1 is specified, bigsql.catalog.sync.sleep defaults to 1 second. If a value greater than 60 is specified, bigsql.catalog.sync.sleep defaults to 60 seconds.

A Note on Table Statistics and Scheduler Cache
When Auto-Sync processes event-files, Big SQL may also schedule an Auto-Analyze task and from Big SQL 4.2, the Big SQL Scheduler cache is also automatically flushed. For more information see:

Summary
In this blog we presented a high level view of the Big SQL Auto-Sync architecture. We saw how JSON formatted DDL event-files are written to the events-directory (by default: /user/bigsql/sync) and processed to ensure the Big SQL catalog and Hive metastore stay synchronized at all times. We also presented the main configuration parameters available for controlling Auto-Sync behaviour.

In the next and final blog of this series, we’ll take a look at some problem determination and explain what you can do if experiencing issues related to Big SQL’s Auto-Sync feature.

Additional Information

Analyzing AWS Cost and Usage Reports with Looker and Amazon Athena

$
0
0

Feed: AWS Big Data Blog.

This is a guest post by Dillon Morrison at Looker. Looker is, in their own words, “a new kind of analytics platform–letting everyone in your business make better decisions by getting reliable answers from a tool they can use.” 

As the breadth of AWS products and services continues to grow, customers are able to more easily move their technology stack and core infrastructure to AWS. One of the attractive benefits of AWS is the cost savings. Rather than paying upfront capital expenses for large on-premises systems, customers can instead pay variables expenses for on-demand services. To further reduce expenses AWS users can reserve resources for specific periods of time, and automatically scale resources as needed.

The AWS Cost Explorer is great for aggregated reporting. However, conducting analysis on the raw data using the flexibility and power of SQL allows for much richer detail and insight, and can be the better choice for the long term. Thankfully, with the introduction of Amazon Athena, monitoring and managing these costs is now easier than ever.

In the post, I walk through setting up the data pipeline for cost and usage reports, Amazon S3, and Athena, and discuss some of the most common levers for cost savings. I surface tables through Looker, which comes with a host of pre-built data models and dashboards to make analysis of your cost and usage data simple and intuitive.

Analysis with Athena

With Athena, there’s no need to create hundreds of Excel reports, move data around, or deploy clusters to house and process data. Athena uses Apache Hive’s DDL to create tables, and the Presto querying engine to process queries. Analysis can be performed directly on raw data in S3. Conveniently, AWS exports raw cost and usage data directly into a user-specified S3 bucket, making it simple to start querying with Athena quickly. This makes continuous monitoring of costs virtually seamless, since there is no infrastructure to manage. Instead, users can leverage the power of the Athena SQL engine to easily perform ad-hoc analysis and data discovery without needing to set up a data warehouse.

After the data pipeline is established, cost and usage data (the recommended billing data, per AWS documentation) provides a plethora of comprehensive information around usage of AWS services and the associated costs. Whether you need the report segmented by product type, user identity, or region, this report can be cut-and-sliced any number of ways to properly allocate costs for any of your business needs. You can then drill into any specific line item to see even further detail, such as the selected operating system, tenancy, purchase option (on-demand, spot, or reserved), and so on.

Walkthrough

By default, the Cost and Usage report exports CSV files, which you can compress using gzip (recommended for performance). There are some additional configuration options for tuning performance further, which are discussed below.

Prerequisites

If you want to follow along, you need the following resources:

Enable the cost and usage reports

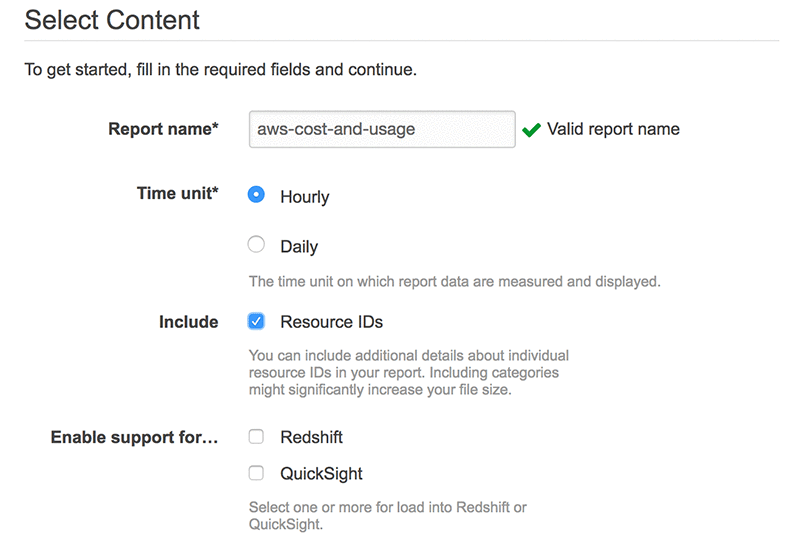
First, enable the Cost and Usage report. For Time unit, select Hourly. For Include, select Resource IDs. All options are prompted in the report-creation window.

The Cost and Usage report dumps CSV files into the specified S3 bucket. Please note that it can take up to 24 hours for the first file to be delivered after enabling the report.

Configure the S3 bucket and files for Athena querying

In addition to the CSV file, AWS also creates a JSON manifest file for each cost and usage report. Athena requires that all of the files in the S3 bucket are in the same format, so we need to get rid of all these manifest files. If you’re looking to get started with Athena quickly, you can simply go into your S3 bucket and delete the manifest file manually, skip the automation described below, and move on to the next section.

To automate the process of removing the manifest file each time a new report is dumped into S3, which I recommend as you scale, there are a few additional steps. The folks at Concurrency labs wrote a great overview and set of scripts for this, which you can find in their GitHub repo.

These scripts take the data from an input bucket, remove anything unnecessary, and dump it into a new output bucket. We can utilize AWS Lambda to trigger this process whenever new data is dropped into S3, or on a nightly basis, or whatever makes most sense for your use-case, depending on how often you’re querying the data. Please note that enabling the “hourly” report means that data is reported at the hour-level of granularity, not that a new file is generated every hour.

Following these scripts, you’ll notice that we’re adding a date partition field, which isn’t necessary but improves query performance. In addition, converting data from CSV to a columnar format like ORC or Parquet also improves performance. We can automate this process using Lambda whenever new data is dropped in our S3 bucket. Amazon Web Services discusses columnar conversion at length, and provides walkthrough examples, in their documentation.

As a long-term solution, best practice is to use compression, partitioning, and conversion. However, for purposes of this walkthrough, we’re not going to worry about them so we can get up-and-running quicker.

Set up the Athena query engine

In your AWS console, navigate to the Athena service, and click “Get Started”. Follow the tutorial and set up a new database (we’ve called ours “AWS Optimizer” in this example). Don’t worry about configuring your initial table, per the tutorial instructions. We’ll be creating a new table for cost and usage analysis. Once you walked through the tutorial steps, you’ll be able to access the Athena interface, and can begin running Hive DDL statements to create new tables.

One thing that’s important to note, is that the Cost and Usage CSVs also contain the column headers in their first row, meaning that the column headers would be included in the dataset and any queries. For testing and quick set-up, you can remove this line manually from your first few CSV files. Long-term, you’ll want to use a script to programmatically remove this row each time a new file is dropped in S3 (every few hours typically). We’ve drafted up a sample script for ease of reference, which we run on Lambda. We utilize Lambda’s native ability to invoke the script whenever a new object is dropped in S3.

For cost and usage, we recommend using the DDL statement below. Since our data is in CSV format, we don’t need to use a SerDe, we can simply specify the “separatorChar, quoteChar, and escapeChar”, and the structure of the files (“TEXTFILE”). Note that AWS does have an OpenCSV SerDe as well, if you prefer to use that.

CREATE EXTERNAL TABLE IF NOT EXISTS cost_and_usage	 (
identity_LineItemId String,
identity_TimeInterval String,
bill_InvoiceId String,
bill_BillingEntity String,
bill_BillType String,
bill_PayerAccountId String,
bill_BillingPeriodStartDate String,
bill_BillingPeriodEndDate String,
lineItem_UsageAccountId String,
lineItem_LineItemType String,
lineItem_UsageStartDate String,
lineItem_UsageEndDate String,
lineItem_ProductCode String,
lineItem_UsageType String,
lineItem_Operation String,
lineItem_AvailabilityZone String,
lineItem_ResourceId String,
lineItem_UsageAmount String,
lineItem_NormalizationFactor String,
lineItem_NormalizedUsageAmount String,
lineItem_CurrencyCode String,
lineItem_UnblendedRate String,
lineItem_UnblendedCost String,
lineItem_BlendedRate String,
lineItem_BlendedCost String,
lineItem_LineItemDescription String,
lineItem_TaxType String,
product_ProductName String,
product_accountAssistance String,
product_architecturalReview String,
product_architectureSupport String,
product_availability String,
product_bestPractices String,
product_cacheEngine String,
product_caseSeverityresponseTimes String,
product_clockSpeed String,
product_currentGeneration String,
product_customerServiceAndCommunities String,
product_databaseEdition String,
product_databaseEngine String,
product_dedicatedEbsThroughput String,
product_deploymentOption String,
product_description String,
product_durability String,
product_ebsOptimized String,
product_ecu String,
product_endpointType String,
product_engineCode String,
product_enhancedNetworkingSupported String,
product_executionFrequency String,
product_executionLocation String,
product_feeCode String,
product_feeDescription String,
product_freeQueryTypes String,
product_freeTrial String,
product_frequencyMode String,
product_fromLocation String,
product_fromLocationType String,
product_group String,
product_groupDescription String,
product_includedServices String,
product_instanceFamily String,
product_instanceType String,
product_io String,
product_launchSupport String,
product_licenseModel String,
product_location String,
product_locationType String,
product_maxIopsBurstPerformance String,
product_maxIopsvolume String,
product_maxThroughputvolume String,
product_maxVolumeSize String,
product_maximumStorageVolume String,
product_memory String,
product_messageDeliveryFrequency String,
product_messageDeliveryOrder String,
product_minVolumeSize String,
product_minimumStorageVolume String,
product_networkPerformance String,
product_operatingSystem String,
product_operation String,
product_operationsSupport String,
product_physicalProcessor String,
product_preInstalledSw String,
product_proactiveGuidance String,
product_processorArchitecture String,
product_processorFeatures String,
product_productFamily String,
product_programmaticCaseManagement String,
product_provisioned String,
product_queueType String,
product_requestDescription String,
product_requestType String,
product_routingTarget String,
product_routingType String,
product_servicecode String,
product_sku String,
product_softwareType String,
product_storage String,
product_storageClass String,
product_storageMedia String,
product_technicalSupport String,
product_tenancy String,
product_thirdpartySoftwareSupport String,
product_toLocation String,
product_toLocationType String,
product_training String,
product_transferType String,
product_usageFamily String,
product_usagetype String,
product_vcpu String,
product_version String,
product_volumeType String,
product_whoCanOpenCases String,
pricing_LeaseContractLength String,
pricing_OfferingClass String,
pricing_PurchaseOption String,
pricing_publicOnDemandCost String,
pricing_publicOnDemandRate String,
pricing_term String,
pricing_unit String,
reservation_AvailabilityZone String,
reservation_NormalizedUnitsPerReservation String,
reservation_NumberOfReservations String,
reservation_ReservationARN String,
reservation_TotalReservedNormalizedUnits String,
reservation_TotalReservedUnits String,
reservation_UnitsPerReservation String,
resourceTags_userName String,
resourceTags_usercostcategory String  


)
    ROW FORMAT DELIMITED
      FIELDS TERMINATED BY ','
      ESCAPED BY '\'
      LINES TERMINATED BY 'n'

STORED AS TEXTFILE
    LOCATION 's3://<>';

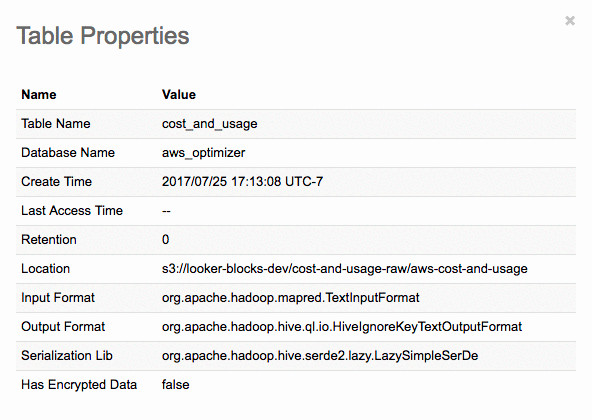
Once you’ve successfully executed the command, you should see a new table named “cost_and_usage” with the below properties. Now we’re ready to start executing queries and running analysis!

Start with Looker and connect to Athena

Setting up Looker is a quick process, and you can try it out for free here (or download from Amazon Marketplace). It takes just a few seconds to connect Looker to your Athena database, and Looker comes with a host of pre-built data models and dashboards to make analysis of your cost and usage data simple and intuitive. After you’re connected, you can use the Looker UI to run whatever analysis you’d like. Looker translates this UI to optimized SQL, so any user can execute and visualize queries for true self-service analytics.

Major cost saving levers

Now that the data pipeline is configured, you can dive into the most popular use cases for cost savings. In this post, I focus on:

  • Purchasing Reserved Instances vs. On-Demand Instances
  • Data transfer costs
  • Allocating costs over users or other Attributes (denoted with resource tags)

On-Demand, Spot, and Reserved Instances

Purchasing Reserved Instances vs On-Demand Instances is arguably going to be the biggest cost lever for heavy AWS users (Reserved Instances run up to 75% cheaper!). AWS offers three options for purchasing instances:

  • On-Demand—Pay as you use.
  • Spot (variable cost)—Bid on spare Amazon EC2 computing capacity.
  • Reserved Instances—Pay for an instance for a specific, allotted period of time.

When purchasing a Reserved Instance, you can also choose to pay all-upfront, partial-upfront, or monthly. The more you pay upfront, the greater the discount.

If your company has been using AWS for some time now, you should have a good sense of your overall instance usage on a per-month or per-day basis. Rather than paying for these instances On-Demand, you should try to forecast the number of instances you’ll need, and reserve them with upfront payments.

The total amount of usage with Reserved Instances versus overall usage with all instances is called your coverage ratio. It’s important not to confuse your coverage ratio with your Reserved Instance utilization. Utilization represents the amount of reserved hours that were actually used. Don’t worry about exceeding capacity, you can still set up Auto Scaling preferences so that more instances get added whenever your coverage or utilization crosses a certain threshold (we often see a target of 80% for both coverage and utilization among savvy customers).

Calculating the reserved costs and coverage can be a bit tricky with the level of granularity provided by the cost and usage report. The following query shows your total cost over the last 6 months, broken out by Reserved Instance vs other instance usage. You can substitute the cost field for usage if you’d prefer. Please note that you should only have data for the time period after the cost and usage report has been enabled (though you can opt for up to 3 months of historical data by contacting your AWS Account Executive). If you’re just getting started, this query will only show a few days.

SELECT 
	DATE_FORMAT(from_iso8601_timestamp(cost_and_usage.lineitem_usagestartdate),'%Y-%m') AS "cost_and_usage.usage_start_month",
	COALESCE(SUM(cost_and_usage.lineitem_unblendedcost ), 0) AS "cost_and_usage.total_unblended_cost",
	COALESCE(SUM(CASE WHEN (CASE
         WHEN cost_and_usage.lineitem_lineitemtype = 'DiscountedUsage' THEN 'RI Line Item'
         WHEN cost_and_usage.lineitem_lineitemtype = 'RIFee' THEN 'RI Line Item'
         WHEN cost_and_usage.lineitem_lineitemtype = 'Fee' THEN 'RI Line Item'
         ELSE 'Non RI Line Item'
        END = 'RI Line Item') THEN cost_and_usage.lineitem_unblendedcost  ELSE NULL END), 0) AS "cost_and_usage.total_reserved_unblended_cost",
	1.0 * (COALESCE(SUM(CASE WHEN (CASE
         WHEN cost_and_usage.lineitem_lineitemtype = 'DiscountedUsage' THEN 'RI Line Item'
         WHEN cost_and_usage.lineitem_lineitemtype = 'RIFee' THEN 'RI Line Item'
         WHEN cost_and_usage.lineitem_lineitemtype = 'Fee' THEN 'RI Line Item'
         ELSE 'Non RI Line Item'
        END = 'RI Line Item') THEN cost_and_usage.lineitem_unblendedcost  ELSE NULL END), 0)) / NULLIF((COALESCE(SUM(cost_and_usage.lineitem_unblendedcost ), 0)),0)  AS "cost_and_usage.percent_spend_on_ris",
	COALESCE(SUM(CASE WHEN (CASE
         WHEN cost_and_usage.lineitem_lineitemtype = 'DiscountedUsage' THEN 'RI Line Item'
         WHEN cost_and_usage.lineitem_lineitemtype = 'RIFee' THEN 'RI Line Item'
         WHEN cost_and_usage.lineitem_lineitemtype = 'Fee' THEN 'RI Line Item'
         ELSE 'Non RI Line Item'
        END = 'Non RI Line Item') THEN cost_and_usage.lineitem_unblendedcost  ELSE NULL END), 0) AS "cost_and_usage.total_non_reserved_unblended_cost",
	1.0 * (COALESCE(SUM(CASE WHEN (CASE
         WHEN cost_and_usage.lineitem_lineitemtype = 'DiscountedUsage' THEN 'RI Line Item'
         WHEN cost_and_usage.lineitem_lineitemtype = 'RIFee' THEN 'RI Line Item'
         WHEN cost_and_usage.lineitem_lineitemtype = 'Fee' THEN 'RI Line Item'
         ELSE 'Non RI Line Item'
        END = 'Non RI Line Item') THEN cost_and_usage.lineitem_unblendedcost  ELSE NULL END), 0)) / NULLIF((COALESCE(SUM(cost_and_usage.lineitem_unblendedcost ), 0)),0)  AS "cost_and_usage.percent_spend_on_non_ris"
FROM aws_optimizer.cost_and_usage  AS cost_and_usage

WHERE 
	(((from_iso8601_timestamp(cost_and_usage.lineitem_usagestartdate)) >= ((DATE_ADD('month', -5, DATE_TRUNC('MONTH', CAST(NOW() AS DATE))))) AND (from_iso8601_timestamp(cost_and_usage.lineitem_usagestartdate)) < ((DATE_ADD('month', 6, DATE_ADD('month', -5, DATE_TRUNC('MONTH', CAST(NOW() AS DATE))))))))
GROUP BY 1
ORDER BY 2 DESC
LIMIT 500

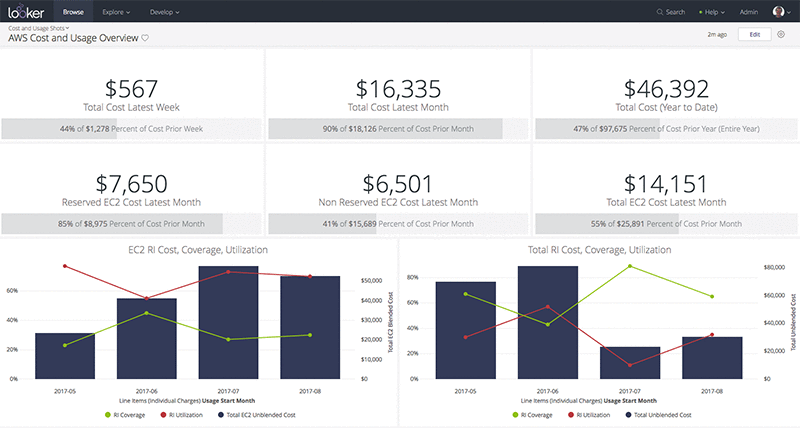
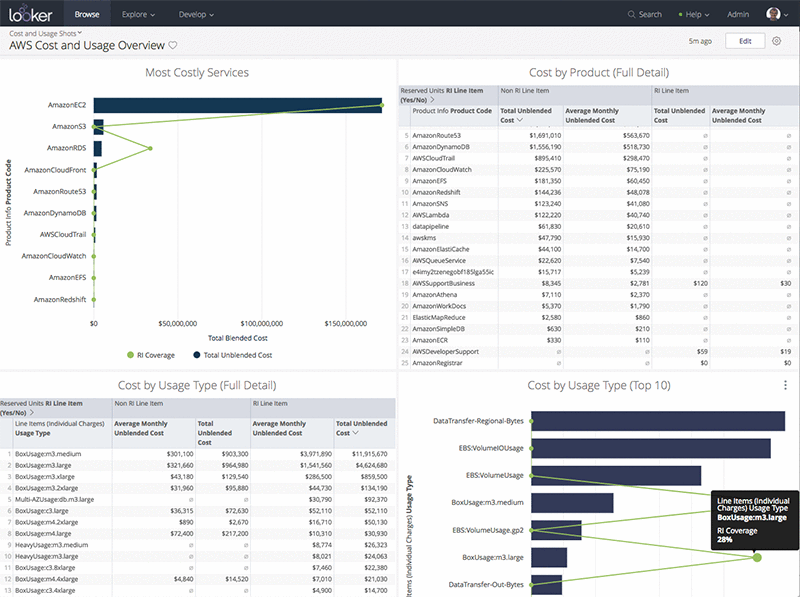
The resulting table should look something like the image below (I’m surfacing tables through Looker, though the same table would result from querying via command line or any other interface).

With a BI tool, you can create dashboards for easy reference and monitoring. New data is dumped into S3 every few hours, so your dashboards can update several times per day.

It’s an iterative process to understand the appropriate number of Reserved Instances needed to meet your business needs. After you’ve properly integrated Reserved Instances into your purchasing patterns, the savings can be significant. If your coverage is consistently below 70%, you should seriously consider adjusting your purchase types and opting for more Reserved instances.

Data transfer costs

One of the great things about AWS data storage is that it’s incredibly cheap. Most charges often come from moving and processing that data. There are several different prices for transferring data, broken out largely by transfers between regions and availability zones. Transfers between regions are the most costly, followed by transfers between Availability Zones. Transfers within the same region and same availability zone are free unless using elastic or public IP addresses, in which case there is a cost. You can find more detailed information in the AWS Pricing Docs. With this in mind, there are several simple strategies for helping reduce costs.

First, since costs increase when transferring data between regions, it’s wise to ensure that as many services as possible reside within the same region. The more you can localize services to one specific region, the lower your costs will be.

Second, you should maximize the data you’re routing directly within AWS services and IP addresses. Transfers out to the open internet are the most costly and least performant mechanisms of data transfers, so it’s best to keep transfers within AWS services.

Lastly, data transfers between private IP addresses are cheaper than between elastic or public IP addresses, so utilizing private IP addresses as much as possible is the most cost-effective strategy.

The following query provides a table depicting the total costs for each AWS product, broken out transfer cost type. Substitute the “lineitem_productcode” field in the query to segment the costs by any other attribute. If you notice any unusually high spikes in cost, you’ll need to dig deeper to understand what’s driving that spike: location, volume, and so on. Drill down into specific costs by including “product_usagetype” and “product_transfertype” in your query to identify the types of transfer costs that are driving up your bill.

SELECT 
	cost_and_usage.lineitem_productcode  AS "cost_and_usage.product_code",
	COALESCE(SUM(cost_and_usage.lineitem_unblendedcost), 0) AS "cost_and_usage.total_unblended_cost",
	COALESCE(SUM(CASE WHEN REGEXP_LIKE(cost_and_usage.product_usagetype, 'DataTransfer')    THEN cost_and_usage.lineitem_unblendedcost  ELSE NULL END), 0) AS "cost_and_usage.total_data_transfer_cost",
	COALESCE(SUM(CASE WHEN REGEXP_LIKE(cost_and_usage.product_usagetype, 'DataTransfer-In')    THEN cost_and_usage.lineitem_unblendedcost  ELSE NULL END), 0) AS "cost_and_usage.total_inbound_data_transfer_cost",
	COALESCE(SUM(CASE WHEN REGEXP_LIKE(cost_and_usage.product_usagetype, 'DataTransfer-Out')    THEN cost_and_usage.lineitem_unblendedcost  ELSE NULL END), 0) AS "cost_and_usage.total_outbound_data_transfer_cost"
FROM aws_optimizer.cost_and_usage  AS cost_and_usage

WHERE 
	(((from_iso8601_timestamp(cost_and_usage.lineitem_usagestartdate)) >= ((DATE_ADD('month', -5, DATE_TRUNC('MONTH', CAST(NOW() AS DATE))))) AND (from_iso8601_timestamp(cost_and_usage.lineitem_usagestartdate)) < ((DATE_ADD('month', 6, DATE_ADD('month', -5, DATE_TRUNC('MONTH', CAST(NOW() AS DATE))))))))
GROUP BY 1
ORDER BY 2 DESC
LIMIT 500

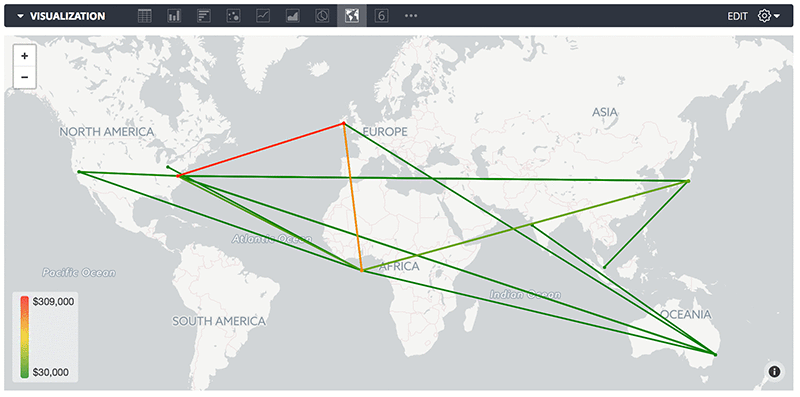
When moving between regions or over the open web, many data transfer costs also include the origin and destination location of the data movement. Using a BI tool with mapping capabilities, you can get a nice visual of data flows. The point at the center of the map is used to represent external data flows over the open internet.

Analysis by tags

AWS provides the option to apply custom tags to individual resources, so you can allocate costs over whatever customized segment makes the most sense for your business. For a SaaS company that hosts software for customers on AWS, maybe you’d want to tag the size of each customer. The following query uses custom tags to display the reserved, data transfer, and total cost for each AWS service, broken out by tag categories, over the last 6 months. You’ll want to substitute the cost_and_usage.resourcetags_customersegment and cost_and_usage.customer_segment with the name of your customer field.

SELECT * FROM (
SELECT *, DENSE_RANK() OVER (ORDER BY z___min_rank) as z___pivot_row_rank, RANK() OVER (PARTITION BY z__pivot_col_rank ORDER BY z___min_rank) as z__pivot_col_ordering FROM (
SELECT *, MIN(z___rank) OVER (PARTITION BY "cost_and_usage.product_code") as z___min_rank FROM (
SELECT *, RANK() OVER (ORDER BY CASE WHEN z__pivot_col_rank=1 THEN (CASE WHEN "cost_and_usage.total_unblended_cost" IS NOT NULL THEN 0 ELSE 1 END) ELSE 2 END, CASE WHEN z__pivot_col_rank=1 THEN "cost_and_usage.total_unblended_cost" ELSE NULL END DESC, "cost_and_usage.total_unblended_cost" DESC, z__pivot_col_rank, "cost_and_usage.product_code") AS z___rank FROM (
SELECT *, DENSE_RANK() OVER (ORDER BY CASE WHEN "cost_and_usage.customer_segment" IS NULL THEN 1 ELSE 0 END, "cost_and_usage.customer_segment") AS z__pivot_col_rank FROM (
SELECT 
	cost_and_usage.lineitem_productcode  AS "cost_and_usage.product_code",
	cost_and_usage.resourcetags_customersegment  AS "cost_and_usage.customer_segment",
	COALESCE(SUM(cost_and_usage.lineitem_unblendedcost ), 0) AS "cost_and_usage.total_unblended_cost",
	1.0 * (COALESCE(SUM(CASE WHEN REGEXP_LIKE(cost_and_usage.product_usagetype, 'DataTransfer')    THEN cost_and_usage.lineitem_unblendedcost  ELSE NULL END), 0)) / NULLIF((COALESCE(SUM(cost_and_usage.lineitem_unblendedcost ), 0)),0)  AS "cost_and_usage.percent_spend_data_transfers_unblended",
	1.0 * (COALESCE(SUM(CASE WHEN (CASE
         WHEN cost_and_usage.lineitem_lineitemtype = 'DiscountedUsage' THEN 'RI Line Item'
         WHEN cost_and_usage.lineitem_lineitemtype = 'RIFee' THEN 'RI Line Item'
         WHEN cost_and_usage.lineitem_lineitemtype = 'Fee' THEN 'RI Line Item'
         ELSE 'Non RI Line Item'
        END = 'Non RI Line Item') THEN cost_and_usage.lineitem_unblendedcost  ELSE NULL END), 0)) / NULLIF((COALESCE(SUM(cost_and_usage.lineitem_unblendedcost ), 0)),0)  AS "cost_and_usage.unblended_percent_spend_on_ris"
FROM aws_optimizer.cost_and_usage_raw  AS cost_and_usage

WHERE 
	(((from_iso8601_timestamp(cost_and_usage.lineitem_usagestartdate)) >= ((DATE_ADD('month', -5, DATE_TRUNC('MONTH', CAST(NOW() AS DATE))))) AND (from_iso8601_timestamp(cost_and_usage.lineitem_usagestartdate)) < ((DATE_ADD('month', 6, DATE_ADD('month', -5, DATE_TRUNC('MONTH', CAST(NOW() AS DATE))))))))
GROUP BY 1,2) ww
) bb WHERE z__pivot_col_rank <= 16384
) aa
) xx
) zz
 WHERE z___pivot_row_rank <= 500 OR z__pivot_col_ordering = 1 ORDER BY z___pivot_row_rank

The resulting table in this example looks like the results below. In this example, you can tell that we’re making poor use of Reserved Instances because they represent such a small portion of our overall costs.

Again, using a BI tool to visualize these costs and trends over time makes the analysis much easier to consume and take action on.

Summary

Saving costs on your AWS spend is always an iterative, ongoing process. Hopefully with these queries alone, you can start to understand your spending patterns and identify opportunities for savings. However, this is just a peek into the many opportunities available through analysis of the Cost and Usage report. Each company is different, with unique needs and usage patterns. To achieve maximum cost savings, we encourage you to set up an analytics environment that enables your team to explore all potential cuts and slices of your usage data, whenever it’s necessary. Exploring different trends and spikes across regions, services, user types, etc. helps you gain comprehensive understanding of your major cost levers and consistently implement new cost reduction strategies.

Note that all of the queries and analysis provided in this post were generated using the Looker data platform. If you’re already a Looker customer, you can get all of this analysis, additional pre-configured dashboards, and much more using Looker Blocks for AWS.


About the Author

Dillon Morrison leads the Platform Ecosystem at Looker. He enjoys exploring new technologies and architecting the most efficient data solutions for the business needs of his company and their customers. In his spare time, you’ll find Dillon rock climbing in the Bay Area or nose deep in the docs of the latest AWS product release at his favorite cafe (“Arlequin in SF is unbeatable!”).

Federico Campoli: Happy birthday pg_chameleon

$
0
0

Feed: Planet PostgreSQL.
Today is one year since I started working seriously on pg_chameleon.
With this commit I changed the project’s license to the 2 clause BSD and the project’s scope, evolving the project into a MySQL to PostgreSQL replica system.

Initially this change was just a try. I needed to synchronise the data between MySQL and PostgreSQL and at that time the only option I had it was to use the MySQL foreign data wrapper, eventually to copy the data locally every now and then. However, because the previous implementation relied on a MySQL replica this approach approach wasn’t really feasible.

If you are curious about the background story and how we scaled the analytics database  in Transferwise you can read it here.

I developed pg_chameleon in my spare time. I like to think about it like  my little commute project.

The first test on large datasets happened during the amazing days of the pgconf eu 2016. I remember how the process were incredibly slow, taking the unacceptable amount of time.  Four days to copy a 600GB database. I found the bottlenecks during the nights between the conference days building a faster implementation.

I also had to cope with the sql dialect conversion. The solution is still in progress.

Initially I decided to use an existing library but after few failures I realised that sqlparse didn’t fit my needs.
So I took the occasion to learn how to use the regular expressions and I doubled my problems at the same time.

In May I presented the project at the Estonian PostgreSQL User Group and the video is available here.

Currently the project is at the version 1.6 which improves the replay speed and comes with better status view with the replay lag along the read lag.

The upcoming release 1.7 will add an optional threaded mode for the replica, where the read and replay processes will run independently.

This version will also see the support for the type override during the init schema and the ddl replay. This change will make simpler to use pg_chameleon as a migration tool (e.g. conversion of tinyint(1) into a boolean).

However the current replay implementation can result in a broken in case of not compatible data pushed into the data fiels (e.g. insert a value >1 in tinyint(1) will throw a type error on postgres if the data is boolean). I’m working on a solution.

I’ve also started the development of the version 2 but I’ve not yet kicked off seriously the coding yet. The reason why is that I’m still learning a lot of things thanks to the feedback I’m getting via github.
I will start the version 2 soon and hopefully I will release the first alpha by the beginning of the next year.

However I’m very happy to see pg_chameleon gaining popularity.

If my work even will help just one person to move from MySQL to PostgreSQL, I feel satisfied.

So, happy birthday to pg_chameleon, my little pet project.

Galera Cluster Comparison – Codership vs Percona vs MariaDB

$
0
0

Feed: Planet MySQL
;
Author: Severalnines
;

Galera Cluster is a synchronous multi-master replication plugin for InnoDB or XtraDB storage engine. It offers a number of outstanding features that standard MySQL replication doesn’t – read-write to any cluster node, automatic membership control, automatic node joining, parallel replication on row-level, and still keeping the native look and feel of a MySQL server. This plug-in is open-source and developed by Codership as a patch for standard MySQL. Percona and MariaDB leverage the Galera library in Percona XtraDB Cluster (PXC) and MariaDB Server (MariaDB Galera Cluster for pre 10.1) respectively.

We often get the question – which version of Galera should I use? Percona? MariaDB? Codership? This is not an easy one, since they all use the same Galera plugin that is developed by Codership. Nevertheless, let’s give it a try.

In this blog post, we’ll compare the three vendors and their Galera Cluster releases. We will be using the latest stable version of each vendor available at the time of writing – Galera Cluster for MySQL 5.7.18, Percona XtraDB Cluster 5.7.18 and MariaDB 10.2.7 where all are shipped with InnoDB storage engine 5.7.18.

Database Release

A database vendor who wish to leverage Galera Cluster technology would need to incorporate the WriteSet Replication (wsrep) API patch into its server codebase. This will allow the Galera plugin to work as a wsrep provider, to communicate and replicate transactions (writesets in Galera terms) via a group communication protocol.

The following diagram illustrates the difference between the standalone MySQL server, MySQL Replication and Galera Cluster:

Codership releases the wsrep-patched version of Oracle’s MySQL. MySQL has already released MySQL 5.7 as General Availability (GA) since October 2015. However the first beta wsrep-patched for MySQL was released a year later around October 2016, then became GA in January 2017. It took more than a year to incorporate Galera Cluster into Oracle’s MySQL 5.7 release line.

Percona releases the wsrep-patched version of its Percona Server for MySQL called Percona XtraDB Cluster (PXC). Percona Server for MySQL comes with XtraDB storage engine (a drop-in replacement of InnoDB) and follows the upstream Oracle MySQL releases very closely (including all the bug fixes in it) with some additional features like MyRocks storage engine, TokuDB as well as Percona’s own bug fixes. In a way, you can think of it as an improved version of Oracle’s MySQL, embedded with Galera technology.

MariaDB releases the wsrep-patched version of its MariaDB Server, and it’s already embedded since MariaDB 10.1, where you don’t have to install separate packages for Galera. In the previous versions (5.5 and 10.0 particularly), the Galera variant’s of MariaDB is called MariaDB Galera Cluster (MGC) with separate builds. MariaDB has its own path of releases and versioning and does not follow any upstream like Percona does. The MariaDB server functionality has started diverging from MySQL, so it might not be as straightforward a replacement for MySQL. It still comes with a bunch of great features and performance improvements though.

System Status

Monitoring Galera nodes and the cluster requires the wsrep API to report several statuses, which is exposed through SHOW STATUS statement:

mysql> SHOW STATUS LIKE 'wsrep%';

PXC does have a number of extra statuses, if compared to other variants. The following list shows wsrep related status that can only be found in PXC:

  • wsrep_flow_control_interval
  • wsrep_flow_control_interval_low
  • wsrep_flow_control_interval_high
  • wsrep_flow_control_status
  • wsrep_cert_bucket_count
  • wsrep_gcache_pool_size
  • wsrep_ist_receive_status
  • wsrep_ist_receive_seqno_start
  • wsrep_ist_receive_seqno_current
  • wsrep_ist_receive_seqno_end

While MariaDB only has one extra wsrep status, if compared to the Galera version provided by Codership:

  • wsrep_thread_count

The above does not necessarily tell us that PXC is superior to the others. It means that you can get better insights with more statuses.

Configuration Options

Since Galera is part of MariaDB 10.1 and later, you have to explicitly enable the following option in the configuration file:

wsrep_ready=ON

Note that if you do not enable this option, the server will act as a standard MariaDB installation. For Codership and Percona, this option is enabled by default.

Some Galera-related variables are NOT available across all Galera variants:

Database Server Variable name
Codership’s MySQL Galera Cluster 5.7.18, wsrep 25.12
  • wsrep_mysql_replication_bundle
  • wsrep_preordered
  • wsrep_reject_queries
Percona XtraDB Cluster 5.7.18, wsrep 29.20
  • wsrep_preordered
  • wsrep_reject_queries
  • pxc_encrypt_cluster_traffic
  • pxc_maint_mode
  • pxc_maint_transition_period
  • pxc_strict_mode
MariaDB 10.2.7, wsrep 25.19
  • wsrep_gtid_domain_id
  • wsrep_gtid_mode
  • wsrep_mysql_replication_bundle
  • wsrep_patch_version

The above list might change once the vendor releases a new version. The only point that we would like to highlight here is, do not expect that Galera nodes hold the same set of configuration parameters across all variants. Some configuration variables were introduced by a vendor to specifically complement and improve the database server.

Contributions and Improvements

Database performance is not easily comparable, as it can vary a lot depending on the workloads. For general workloads, the replication performance are fairly similar across all variants. Under some specific workloads, it could be different.

Looking at the latest claims, Percona did an amazing job improving IST performance up to 4x as well as the commit operation. MariaDB also contributes a number of useful features for example WSREP_INFO plugin. On the other hand, Codership is focusing more on core Galera issues issues, including bug fixing and new features. Galera 4.0 has features like intelligent donor selection, huge transaction support, and non-blocking DDL.

The introduction of Percona Xtrabackup (a.k.a xtrabackup) as part of Galera’s SST has improved the SST performance significantly. The syncing process becomes faster and non-blocking to the donor. MariaDB then came up with its own xtrabackup fork called MariaDB Backup (mariabackup) which supported by Galera’s SST method through variable wsrep_sst_method=mariabackup. It also supports installation on Microsoft Windows.

Support

All Galera Cluster variants software are open-source and available for free. This includes the syncing software supported by Galera like mysqldump, rsync, Percona Xtrabackup and MariaDB Backup. For community users, you can seek for support, ask for questions, file a bug report, feature request or even make a pull request to the vendor’s respective support channels:

Each vendor provides commercial support services.

Summary

We hope that this comparison gives you a clearer picture and helps you determine which vendor that better suits your need. They all use pretty much the same wsrep libraries, the differences would be mainly on the server side – for instance, if you want to leverage some specific features in MariaDB or Percona Server. You might want to check out this blog that compares the different servers (Oracle MySQL, MariaDB and Percona Server). ClusterControl supports all of the three vendors, so you can easily deploy different clusters and compare them yourself with your own workload, on your own hardware. Do give it a try.

Big SQL Automatic Catalog Synchronization – Error Handling

$
0
0

Feed: Hadoop Dev.
Author: Shay Roe.

Introduction
Big SQL 5.0.1, includes a significant update to how the Automatic Catalog Synchronization (Auto-Sync) feature handles errors encountered during DDL event synchronization.

Big SQL Auto-Sync was introduced in v4.2 and enables Big SQL to automatically synchronize Hive metastore changes into the Big SQL catalog, so that, any DDL operations (CREATE, ALTER, DROP) resulting in an update to the metastore, will be automatically reflected in the Big SQL catalog. For more details see my previous blog series on Big SQL Automatic Catalog Synchronization.

In this blog we will provide the details on the latest update to Auto-Sync’s error handling, describe the problems it solves, outline the benefits to Big SQL users and also show a simple example of what the behaviour looks like in practice.

Auto-Sync Error Handling – Prior to Big SQL 5.0.1
In previous Big SQL releases, if an Auto-Sync synchronization error was encountered, all relevant information was written to the Big SQL log-file (bigsql.log), and the associated event-file was left in the events-directory (by default: /user/bigsql/sync) so that, when the issue causing the error was resolved, Auto-Sync, on its next invocation, would re-process the event-file and synchronize any associated DDL events. However, if the issue resulting in synchronization errors was not resolved, this approach would result in Auto-Sync attempting to re-process the same event-file(s) every ‘n‘ seconds, potentially impacting Auto-Sync’s performance and flooding bigsql.log with the same error messages every ‘n‘ seconds. (Where ‘n’ is the time, in seconds, Big SQL waits between processing event-files, set via the ‘bigsql.catalog.sync.sleep‘ parameter – see my previous blog on Auto-Sync Architecture for more details).

Auto-Sync Error Handling – Big SQL 5.0.1
As depicted in Figure 1, a synchronization failure encountered by Auto-Sync in Big SQL 5.0.1 will too have all the relevant information written to bigsql.log, however, now the associated event-file is moved out of the events-directory and into an “errors” sub-directory, referred to as the “errors-directory” throughout this blog (by default: /user/bigsql/sync/errors).

Fig.1 – Big SQL Auto-Sync Error Handling

This minor change in Auto-Sync behaviour actually has a number of significant benefits to Big SQL users, as outlined below:

Big SQL 5.0.1 Auto-Sync Error Handling Update – Benefits to Users
    1. A more efficient Auto-Sync execution and a cleaner more readable bigsql.log
      By moving any event-files associate with Auto-Sync synchronization failures out of the events-directory, Auto-Sync will no longer attempt to re-process event-files known to have issues until the user deems it appropriate to do so. This results in Auto-Sync running more efficiently and reduces the number of errors written to bigsql.log file to one single error.
    2. Easier monitoring of Auto-Sync errors
      It is now very easy (and also good practice) to monitor the errors-directory for any synchronization errors that may have occurred. If there are errors, more details can then be found in bigsql.log.
    3. The ability to re-process any DDL error event-files on demand
      When the issues causing synchronization errors have been addressed, and where synchronization of the related object(s) is still required, the associated event-files can be simply moved back into the events-directory (by default: /user/bigsql/sync) and Auto-Sync will synchronize the related DDL events.

Note: Pre-Existing “errors” File or Sub-directory in the Events-directory?

  • If you already have an errors sub-directory in the events-directory and you encounter an Auto-Sync synchronization error, the event-file associated with this synchronization error will be moved into the pre-existing “errors” sub-directory.
  • If you happen to already have a file named “errors” in the events-directory and you encounter an Auto-Sync synchronization error, the file will be renamed to “errors.bak“, an “errors” sub-directory will be created and the event-file associated with the synchronization error will be moved into the newly created errors-directory.

Example
Say we have an event-file, DDL-20170823033725787-f05de07d-6aa0-4732-a2c8-c71cef3eaac1.json, in the events-directory, as shown in Figure 2. This event-file is the result of a CREATE table DDL statement executed in Hive.

Fig.2 – Auto-Sync event-file in events-directory

If, when Auto-Sync executes next, this event fails to synchronize with the Big SQL catalog, the relevant messages will be written to bigsql.log and the event-file, DDL-20170823033725787-f05de07d-6aa0-4732-a2c8-c71cef3eaac1.json, will be moved to the Auto-Sync errors-directory (by default: /user/bigsql/sync/errors), as shown in Figure 3.

Fig.3 – Auto-Sync event-file moved to errors-directory & bigsql.log entry

Conclusion
In this blog we introduced the latest update to how Big SQL Automatic Catalog Synchronization (Auto-Sync) handles errors encountered during DDL event synchronization. We saw the problems it solves, the benefits of this update to Big SQL users and presented a simple example of what the behaviour looks like in practice.

Additional Information

Apache Phoenix Joins Cloudera Labs

$
0
0

Feed: Cloudera Labs – Cloudera Engineering Blog.
Author: Justin Kestelyn.

We are happy to announce the inclusion of Apache Phoenix in Cloudera Labs.

[Update: A new package for Apache Phoenix 4.7.0 on CDH 5.7 was released in June 2016.]

Apache Phoenix is an efficient SQL skin for Apache HBase that has created a lot of buzz. Many companies are successfully using this technology, including Salesforce.com, where Phoenix first started.

With the news that Apache Phoenix integration with Cloudera’s platform has joined Cloudera Labs, let’s take a closer look at a few key questions surrounding Phoenix: What does it do? Why does anyone want to use it? How does it compare to existing solutions? Do the benefits justify replacing existing systems and infrastructure?

In this post, we’ll try to answers those questions by briefly introducing Phoenix and then discussing some of its unique features. I’ll also cover some use cases and compare Phoenix to existing solutions.

What is Apache Phoenix?

Phoenix adds SQL to HBase, the distributed, scalable, big data store built on Hadoop. Phoenix aims to ease HBase access by supporting SQL syntax and allowing inputs and outputs using standard JDBC APIs instead of HBase’s Java client APIs. It lets you perform all CRUD and DDL operations such as creating tables, inserting data, and querying data. SQL and JDBC reduce the amount of code users need to write, allow for performance optimizations that are transparent to the user, and opens the door to leverage and integrate lots of existing tooling.

Internally, Phoenix takes your SQL query, compiles it into a series of native HBase API calls, and pushes as much work as possible onto the cluster for parallel execution. It automatically creates a metadata repository that provides typed access to data stored in HBase tables. Phoenix’s direct use of the HBase API, along with coprocessors and custom filters, results in performance on the order of milliseconds for small queries, or seconds for tens of millions of rows.

Use Cases

Phoenix is good for fast HBase lookups. Its secondary indexing feature supports many SQL constructs and make lookup via non-primary key fields more efficient than full table scans. It simplifies the creation and management of typed row-centric data by providing composite row keys and by enforcing constraints on data when written using the Phoenix interfaces.

Phoenix provides a way to transparently salt the row key, which helps in avoiding the RegionServer hotspotting often caused by monotonically increasing rowkeys. It also provides multi-tenancy via a combination of multi-tenant tables and tenant-specific connections. With tenant-specific connections, tenants can only access data that belongs to them, and with multi-tenant tables, they can only see their own data in those tables and all data in regular tables.

Regardless of these helpful features, Phoenix is not a drop-in RDBMS replacement. There are some limitations:

  • Phoenix doesn’t support cross-row transactions yet.
  • Its query optimizer and join mechanisms are less sophisticated than most COTS DBMSs.
  • As secondary indexes are implemented using a separate index table, they can get out of sync with the primary table (although perhaps only for very short periods.) These indexes are therefore not fully-ACID compliant.
  • Multi-tenancy is constrained—internally, Phoenix uses a single HBase table.
Comparisons to Hive and Impala

The other well known SQL alternatives to Phoenix on top of HBase are Apache Hive and Impala. There is significant overlap in the functionality provided by these products. For example, all of them follow SQL-like syntax and provide a JDBC driver.

Unlike Impala and Hive, however, Phoenix is intended to operate exclusively on HBase data; its design and implementation are heavily customized to leverage HBase features including coprocessors and skip scans.

Some other considerations include:

  • The main goal of Phoenix is to provide a high-performance relational database layer over HBase for low-latency applications. Impala’s primary focus is to enable interactive exploration of large data sets by providing high-performance, low-latency SQL queries on data stored in popular Hadoop file formats. Hive is mainly concerned with providing data warehouse infrastructure, especially for long-running batch-oriented tasks.
  • Phoenix is a good choice, for example, in CRUD applications where you need the scalability of HBase along with the facility of SQL access. In contrast, Impala is a better option for strictly analytic workloads and Hive is well suited for batch-oriented tasks like ETL.
  • Phoenix is comparatively lightweight since it doesn’t need an additional server.
  • Phoenix supports advanced functionality like multiple secondary-index implementations optimized for different workloads, flashback queries, and so on. Neither Impala nor Hive have any provision for supporting secondary index lookups yet.

The following table summarizes what we’ve discussed so far:

Installation

To install Phoenix, you will need HBase 1.0, which ships as part of CDH 5.4). Source code is available here.

  1. Find the Phoenix parcels here.
  2. Install the parcel into Cloudera Manager as explained here. This operation adds a new parcel repository to your Cloudera Manager configuration. Download, distribute, and activate the Phoenix parcel, following the instructions here.
  3. In case you are planning to use secondary indexing feature, please add the following to hbase-site.xml before restarting the HBase service.

  4. After you activate the Phoenix parcel, confirm that the HBase service is restarted.

Phoenix Command-line Tools

Important Phoenix command-line tools are located in /usr/bin. Set the JAVA_HOME environment variable to your JDK installation directory before using the command-line.tools and ensure that java is available in PATH. For example:

  • phoenix-sqlline.py is terminal interface to execute SQL from the command line. To start it, you need to specify the Apache ZooKeeper quorum of the corresponding HBase cluster (for example, phoenix-sqlline.py zk01.example.com:2181). To execute SQL scripts from the command line, you can include a SQL file argument such as sqlline.py zk01.example.com:2181 sql_queries.sql.
  • phoenix-psql.py is for loading CSV data and/or executing SQL scripts (example: phoenix-psql.py  zk01.example.com:2181 create_stmts.sql data.csv sql_queries.sql).
  • phoenix-performance.py is a script for creating as many rows as you want and running timed queries against them (example: phoenix-psql.py  zk01.example.com:2181 100000).

Future Work

The Phoenix project is investigating integration with transaction managers such as Tephra (from Cask). It is also trying to incorporate query optimizations based on the size and cardinality of the data. Although Phoenix supports tracing now, more work is needed to round out its monitoring and management capabilities.

Conclusion

Phoenix offers some unique functionality for a certain set of HBase use cases. As with everything else in Cloudera Labs, Phoenix integration is not supported yet and it’s for experimentation only. If you have any feedback or comments, let us know via the Cloudera Labs discussion forum.

Srikanth Srungarapu is a Software Engineer at Cloudera, and an HBase committer.

Announcing Big SQL 5.0.1

$
0
0

Feed: Hadoop Dev.
Author: JessicaLeeYau.

Announcing the immediate availability of Big SQL v5.0.1 – maintenance release

Big SQL, a SQL engine on Hadoop, has been making strides with the fast-evolving open source ecosystem. The core capabilities of Big SQL focusses on federation, SQL compatibility, scalability, performance, and of course enterprise security, making it a desirable query engine to seek insights from disparate data sources including Hadoop.

We announced Big SQL v5.0 in July, 2017 following our partnership announcement with Hortonworks. Following that, we now announce the release of Big SQL v5.0.1 which focuses on  consumability  (support for – Zeppelin notebook, CentOS,  Sandbox and other enterprise capabilities).  It also includes an automated tool for migrations and upgrades. Here are the highlights of Big SQL v5.0.1 release: 

  • Introducing support on CentOS
    • Big SQL v5.0.1 will now be supported on CentOS v6.8 and v7.2 (x86-64)
  • Connect to Big SQL using Zeppelin (available in HDP)
    • You can now query and visualize data using Zeppelin by connecting to Big SQL. Using Big SQL, you can access data on disparate sources for efficient execution of the queries.
  • Tool for BigInsights customers to migrate to Hortonworks Data Platform (HDP) 2.6.2 and upgrade to Big SQL 5.0.1
    • An automated tool is available for BigInsights (IBM Open Platform) customers to migrate to the latest version of HDP
    • An automated tool is available for BigInsights (Big SQL v4.2 and v4.2.5) customers to upgrade to the latest version of Big SQL on HDP
  • Improved enterprise capabilities
    • Improved integration with Spark for every Big SQL worker when Elastic boost is enabled
    • Big SQL can now be managed by YARN in a Kerberized environment as well.
    • Improved memory handling/resource management
    • Enhanced performance and scalability for ORC file formats
    • Big SQL takes away the pain of renewing Kerberized tickets manually and now automatically renews when they expire
    • Some improvements in HA usability and resiliency
  • Enhanced SQL Compatibility
    • Now available is support for BINARY and VARBINARY datatypes when executing DDL like CREATE HADOOP TABLE
    • To improve compatibility with dashDB, Netezza and Hive, Big SQL now supports improved decimal division semantics allowing a minimum scale of 6 for the result, and also supports new types like int2, int4, int8, float4, float8
  • Big SQL sandbox (coming soon)
    • A quick and easy way to install and try out Big SQL (on HDP 2.6.2) is just a few clicks away. The Big SQL sandbox and tutorials are coming soon to the Big SQL marketplace

Technical documentation can be found in IBM Knowledge Center.

Big SQL 5.0.1 is available for download from Passport Advantage and Passport Advantage Express website. 

More information on Hortonworks Data Platform (HDP) 2.6.2: https://docs.hortonworks.com/HDPDocuments/HDP2/HDP-2.6.2/bk_release-notes/content/ch01s03s01.html 


Big SQL Automatic Catalog Synchronization (Part 3 – Problem Determination)

$
0
0

Feed: Hadoop Dev.
Author: Shay Roe.

Introduction
This blog is part of a series outlining all you need to know to start working with Big SQL’s Automatic Catalog Synchronization (Auto-Sync). Part 1 of the series provided an introduction to Auto-Sync, discussing its significance, the problem it addresses and how it can be enabled/disabled in Ambari. Part 2 presented a high-level view of the Auto-Sync architecture and provided details on the feature’s main configuration parameters.

In this third and final blog of the series, we’ll take a look at problem determination and explain what you can do if experiencing issues related to Big SQL’s Auto-Sync feature.

AutoHcatSync_Arch
Fig.1 – Big SQL Auto-Sync Architecture

Problem Determination
If you are experiencing unexpected behavior that you suspect may be related to the Big SQL Auto-Sync feature, there are a couple of places you should look first:

Note: Big SQL 5.0.1’s Auto-Sync Error Handling
Big SQL 5.0.1 includes an update to how Auto-Sync handles errors encountered during DDL event synchronization. In Big SQL 5.0.1, a synchronization failure encountered by Auto-Sync will, like previous versions of Big SQL, have all the relevant information written to bigsql.log, however, now the associated event-files will be moved out of the events-directory and into an “errors” sub-directory, referred to as the “errors-directory” (by default: /user/bigsql/sync/errors). This change in behaviour results in a number of significant benefits to Big SQL users. For more information on this you can take a look at one of my other blog post: Big SQL Automatic Catalog Synchronization – Error Handling.

1. The Big SQL Log File – bigsql.log
One place to look is the bigsql.log file (by default: /var/ibm/bigsql/logs/bigsql.log). This is where all debug and error messages are written by Auto-Sync during the processing of DDL event-files. If Big SQL encountered a problem while processing an event-file and synchronizing the associated DDL event, there will be an ERROR entry in bigsql.log containing detailed and specific information related to that particular error.

Note: The bigsql.log file may “rollover“. That is, the Auto-Sync log messages you are looking for may be in a ‘bigsql.log.n‘ log file (eg: bigsql.log.1) rather than in bigsql.log.

    Tip: Enable DEBUG Logging
    With debug logging enabled, more information will be written to the bigsql.log file, making it easier to troubleshoot an Auto-Sync issue.

    To enable debug logging, do the following:

    1. Append (or uncomment) the following in the head node’s $BIGSQL_HOME/conf/log4j.properties file:
      log4j.logger.com.ibm.biginsights.biga=DEBUG
      log4j.logger.com.ibm.biginsights.bigsql=DEBUG
      log4j.logger.com.ibm.biginsights.catalog=DEBUG
    2. Save the file
    3. Restart Big SQL
    4. Wait for any event-files to be re-processed by Auto-Sync

    You will then get all relevant DEBUG information written to the bigsql.log file.

    Note: Don’t forget to revert to the original values in the log4j.properties file when finished troubleshooting.

2. The Events-Directory
Another place to look is in the events-directory (by default: /user/bigsql/sync). If Auto-Sync encounters a synchronization error, associated event-files are left in the events-directory to be re-processed by Auto-Sync once the underlying issue has been resolved. Therefore, the presence of such files indicate a potential Auto-Sync problem that should be investigated. You can simply cat these event-files in order to extract the relevant information related to the DDL event that failed to synchronize, as shown in Figure 2, and use this to obtain further details related to the error in the bigsql.log file. This is the approach taken in the example outlined below.

3. Problem Resolution
In the majority of cases this will provide the necessary information for a Big SQL user to determine the root cause of the synchronization issue and set about resolving it. Once resolved, any related event-files remaining in the events-directory will be successfully processed by Auto-Sync and the Big SQL catalogs will be synchronized as expected.

Note: Delay in Processing New event-files
If Auto-Sync is already busy processing DDL events and synchronizing the Big SQL catalog, there may be a slight lag in the processing of new event-files written to the events-directory. This is especially true where there were a large number of event-files in the events-directory to begin with. This behaviour can make it appear as though there is a problem and Auto-Sync isn’t doing its job, however, under these circumstances synchronization has just been delayed and all new event-files will be processed during the next execution of Auto-Sync.

Example
Say we have an event-file, DDL-20170823033725787-f05de07d-6aa0-4732-a2c8-c71cef3eaac1.json, in the events-directory, as shown in Figure 2. This event-file is the result of a CREATE table DDL statement executed in Hive.

Fig.2 – Auto-Sync event-file in events-directory

If, when Auto-Sync executes next, this DDL event fails to synchronize with the Big SQL catalog, the relevant messages will be written to bigsql.log, as shown in Figure 3, and the associated event-file, DDL-20170823033725787-f05de07d-6aa0-4732-a2c8-c71cef3eaac1.json, will be left in the events-directory for re-processing when Auto-Sync executes next.

Fig.3 – Auto-Sync event-file left in events-directory & bigsql.log entry

The DDL event will be successfully synchronized and the associated event-file removed when the underlying issues has been resolved by the user.

Summary
This was the third and final blog in a series outlining all you need to know to start working with Big SQL’s Automatic Catalog Synchronization (Auto-Sync), the Big SQL feature providing automatic synchronization of metadata between the Hive metastore and the Big SQL catalog.

Throughout the series we looked at various aspects of Auto-Sync. In part 1 we considered the significance of the feature, we outlined the problem it addresses and saw how to enable/disabe Auto-Sync via the Ambari interface. In part 2 of the series we presented a high-level view of the Auto-Sync architecture. We saw how JSON-formatted event-files are written to the events-directory on HDFS (by default: /user/bigsql/sync) and processed to ensure that the Big SQL catalog and Hive metastore stay synchronized at all times. In part 2 we also presented the main configuration parameters available for controlling Big SQL’s Auto-Sync behaviour.

Finally, in this blog we closed out the series by taking a look at problem determination as it relates to the Auto-Sync feature and explained what you can do if experiencing issues related to Big SQL’s Auto-Sync.

Additional Information

Big SQL Problem Determination: Data Collection (Part 1)

$
0
0

Feed: Hadoop Dev.
Author: JamieNisbet.

Introduction

Problem determination is not simple. The solution to a problem might be simple (if you’re lucky!), but going from PROBLEM ==> SOLUTION is where the time and effort is spent!

Let’s put on our detective hats! In order for a detective to solve a crime, they need evidence and clues. What information do you need in order to be able to properly investigate and solve a problem in Big SQL?

As a frequent investigator of diagnostics myself, often I do not know what information I need until I need it! We cannot always predict what information is going to have the clues to crack open the case.

Fortunately in Big SQL, we have a number of data collection tools to make this simpler. In the following sections of this blog, we’ll review what data to collect as determined by the nature of the problem you are experiencing.

Specifically, we’ll be introducing 2 data collection scripts that are built into Big SQL version 5.0.1:

  • bigsql-support.sh – a script that collects all Big SQL logs and configuration information.
  • bigsql-collect-perf.sh – A performance data collector that collects “live” information and performance data at regular intervals.

Step 1) Classify the problem

You can’t investigate a problem if you don’t know what the problem is!

Ask yourself these questions:

  • Crash: Is it a crash, did something (or some service) go down?
  • Error: Is it an error message, where something failed, but the services are still running?
  • Performance: Is something unresponsive, hung, or simply taking too long to return?
  • Sys Admin: Is it an install problem, or an issue with adding/dropping a node?
  • I Don’t Know: I have no clue what the problem is!

Bonus questions for extra fame and glory! :

  • When did the problem happen?
  • Was the problem caused by a new or ad hoc task/query/workload?
  • Was the problem caused by a task/query/workload that historically worked fine, but has just started to be an issue recently?
  • Has anything changed in the environment between the time when the task/query/workload was successful to now when it is no longer successful?

Step 2) Collect data for the problem, depending on the problem type

Problem Type: “I Don’t Know”

If the problem description is too vague or there’s some confusion around what the actual problem is, then get everything!

In ambari, click on IBM Big SQL->Service Actions->Collect Big SQL Logs. This launches the bigsql-support tool with a default set of options that collects all logs and configs from all nodes.

Collect Big SQL Logs

Since it’s collecting information from all nodes, the result file may be large, but it’s better to get everything rather than risk missing a key piece of information that could help solve a case. Drill down into the ambari output to see the files that it created. The resultant tar.gz file will contain all of the diagnostics.

Collect logs output

Problem Types: Crash, Error, or Sys Admin

From the OS shell command line, use the bigsql support tool executed from the head node as the bigsql user. The default syntax is as follows (referencing the appropriate version identifier for your software level, in this case 5.0.1.0), which will collect information from the head node only:
/usr/ibmpacks/bigsql/5.0.1.0/bigsql/install/bigsq_support.sh

That’s it! No arguments needed.

If you will be speaking to a support engineer for a pmr, this is the essential “must gather” first data collection for just about any problem you can think of as it provides all the logs, software levels, configurations, and other background information from the head node that will form the starting point of any investigation.

Important:
The above syntax only gets information from the head node. This is a good starting point to investigate many issues, however if a crash or error is specific to a particular worker node, then you will need to refine the data collection strategy so that it collects information from other nodes, such as the Big SQL workers.

Of course, the easiest way to do this would be to simply collect it from all nodes! If you take that approach, then please see the method above for the “I don’t know” problem type.

Why not always just get the info from all nodes? ==> The amount of data from all the hosts in a cluster may be large and slow to transfer it to interested parties (i.e. Big SQL support team). Certainly, a full node collection is the most comprehensive, but often it’s overkill. Instead, whenever possible, try to limit the collection to the nodes that you know are interesting for a particular problem.

To collect information from workers:
Create a file that will contain a list of the hosts, each hostname in it’s own line of the file, and use the -f option of the tool with this file as input.

Example contents of an input file “support_hosts.txt”:

bigsql@oak ~/temp> cat support_hosts.txt 
oak1.fyre.ibm.com
oak3.fyre.ibm.com

Example data collection for a specific set of hosts:

bigsql@oak1 ~/temp> /usr/ibmpacks/bigsql/5.0.1.0/bigsql/install/bigsql-support.sh -f support_hosts.txt 
Log file for this shell on oak1.fyre.ibm.com is: /tmp/bigsql/logs/bigsql-support-2017-08-21_09.57.47.4156.log
bigsql-support.sh                                              100%   34KB  34.2KB/s   00:00    
bigsql-util.sh                                                 100%   23KB  23.4KB/s   00:00    
Spawned child 5147
Log file for this shell on oak1.fyre.ibm.com is: /tmp/bigsql/logs/bigsql-support-2017-08-21_09.57.47.4156.log
Executing db2support tool ...
bigsql-support.sh                                              100%   34KB  34.2KB/s   00:00    
bigsql-util.sh                                                 100%   23KB  23.4KB/s   00:00    
Spawned child 5629
Total numPid:2
Waiting for 0, pid 5147
Log file for this shell on oak3.fyre.ibm.com is: /tmp/bigsql/logs/bigsql-support-2017-08-21_09.57.47.4156.log
chmod: changing permissions of ‘/tmp/bigsql/logs’: Operation not permitted
Executing db2support tool ...
Adding db2support file to archive ...
Adding miscelleneous data collection to the archive ...
Adding install logs files to archive ...
Adding bigsql diagnostic logs logs to archive ...

Support processing is complete on oak1.fyre.ibm.com. Log file can be found at /tmp/bigsql/logs/bigsql-support-2017-08-21_09.57.47.4156.log

bigsql-support: Success on idx:0 host:oak1.fyre.ibm.com pid:5147[0]
Waiting for 1, pid 5629
Adding db2support file to archive ...
Adding miscelleneous data collection to the archive ...
Adding install logs files to archive ...
Adding bigsql diagnostic logs logs to archive ...

Support processing is complete on oak3.fyre.ibm.com. Log file can be found at /tmp/bigsql/logs/bigsql-support-2017-08-21_09.57.47.4156.log

bigsql-support: Success on idx:1 host:oak3.fyre.ibm.com pid:5147[1]

Support processing is complete on oak1.fyre.ibm.com. Log file can be found at /tmp/bigsql/logs/bigsql-support-2017-08-21_09.57.47.4156.log

Support archive is:  /tmp/bigsql/support/bigsql_support_full_archive_2017-08-21_09.57_ver1.tar.gz

Pro tips!!

Which nodes should I get info from?
Must gather always! : head node

For a crash or error problem, if you know that “something happened” on worker node n, then in addition to the head node, ensure that you collect information from the given worker by specifying the appropriate hosts and using -f like the above example.

How do I know which worker was responsible for an error?

Some error codes in Big SQL give you a hint about which node has produced the error. Take this error for example:

[State: 58040][Code: -5105]: The statement failed because a Big SQL component encountered an error. Component receiving the error: "DDL FMP". Component returning the error: "DDL FMP". Log entry identifier: "[BSL-0-605a648c8]".. SQLCODE=-5105, SQLSTATE=58040, DRIVER=3.72.24

The “Log entry identifier” has a clue in it. The syntax of this identifier is:
log_type-node_number-log_entry_identifier

Log type may be: BSL, NRL, SCL, etc. The Big SQL support tool collects all of these logs. The key thing to pay attention to is the node number. This is the logical node number as reflected in the first column of the db2nodes.cfg file.

bigsql@oak1 ~> cat /home/bigsql/sqllib/db2nodes.cfg 
0 oak1.fyre.ibm.com 0 oak1.fyre.ibm.com
1 oak2.fyre.ibm.com 0 oak2.fyre.ibm.com
2 oak3.fyre.ibm.com 0 oak3.fyre.ibm.com
3 oak2.fyre.ibm.com 1 oak2.fyre.ibm.com
4 oak3.fyre.ibm.com 1 oak3.fyre.ibm.com

In the above example error message then, we know that it came from the host oak1.fyre.ibm.com (corresponding to logical node 0), and thus for a data collection around this problem it would be important to ensure data is collected from that host.

For reference, see also some more information about Diagnosing Big SQL Errors

Problem Type: Performance (or something is not responsive like a “hang”)

See Part 2 of the data collection blog

Big SQL Ingest – Adding files directly to HDFS

$
0
0

Feed: Hadoop Dev.
Author: Nailah Bissoon.

There are several ingestion techniques that can be used to add data to Big SQL and Hive. This blog will give an overview of the various flavors of adding files or appending to files already in HDFS and the commands to execute from either Hive or Big SQL. The technique of adding files directly to HDFS can offer one of the fastest ways to ingest data into Hadoop.

Create External Hadoop Tables

If files already reside on HDFS, Big SQL tables can be created with the location of these files specified. These tables are referred to as ‘external’ tables. There are several external ETL tools to Big SQL that can be used to generate these types of files such as Apache Storm, Ab Initio and DataStage. The CREATE HADOOP TABLE statement with the LOCATION clause specified can be used to inform Big SQL of the location of the data files on HDFS. In this example, hadoop commands are used to add the files to HDFS and Big SQL commands are shown to create the external table.


$hadoop fs -mkdir '/user/hadoop/t1'
$hadoop fs -put t1_1.txt '/user/hadoop/t1
$hadoop fs -ls '/user/hadoop/t1'
Found 1 items
-rw-r--r--   3 nbissoon hdfs         87 2016-12-16 13:41 /user/hadoop/t1/t1_1.txt

$hadoop fs –cat /user/hadoop/t1/t1_1.txt
1,1
2,1
3,1
4,1

jsqsh> CREATE HADOOP TABLE t1
    (c1 int, c2 int)
    ROW FORMAT DELIMITED FIELDS TERMINATED BY ','
    LOCATION '/user/hadoop/t1';

jsqsh> select * from t1;
+----+---+
| C1 | C2|
+----+---+
|  1 | 1 |
|  2 | 1 |
|  3 | 1 |
|  4 | 1 |
+----+---+

Add/remove/append to files on HDFS into existing external tables

If Big SQL external tables are already created and new data files are being added/removed or data is being appended into the original HDFS files, Big SQL will be able to recognize that these files/updated files are associated with the existing table. The Big SQL scheduler cache refreshes occur by default every 20 minutes or after any DDL operation such as create/drop/alter is done from Big SQL (since Big SQL 4.2). Not until the refresh will Big SQL be made aware of the new/changed files on HDFS. There is a stored procedure which can be executed manually to instruct Big SQL to refresh its cache. For example, using the same table t1 created in the example above, the commands below can be used to add a new file (t1_2.txt) to the location specified in the create Hadoop table clause and the HCAT-CACHE-SYNC stored procedure can be called to refresh the scheduler cache:


$hadoop fs -mkdir '/user/hadoop/t1
$hadoop fs -put t1_2.txt '/user/hadoop/t1’
$hadoop fs –cat /user/hadoop/t1/t1_2.txt
1,2
2,2
3,2
4,2

jsqsh> select * from t1;
+----+---+
| C1 | C2|
+----+---+
|  1 | 1 |
|  2 | 1 |
|  3 | 1 |
|  4 | 1 |
+----+---+

–-Tell the Big SQL Scheduler to flush its cache for table t1
jsqsh> CALL SYSHADOOP.HCAT_CACHE_SYNC (‘bigsql’,’t1’);

jsqsh> select * from t1;
+----+---+
| C1 | C2|
+----+---+
|  1 | 1 |
|  2 | 1 |
|  3 | 1 |
|  4 | 1 |
|  1 | 2 |
|  2 | 2 |
|  3 | 2 |
|  4 | 2 |
+----+---+

The Big SQL scheduler.tableMetaDataCache.timeToLive property in bigsql-conf.xml can be used to configure a new cache refresh time from the default of 20 minutes. However, there is a performance penalty refreshing the cache too often.

Add partitions into partitioned tables

Partitioned tables are recommended for performance reasons when tables are large. Data corresponding to each partition resides in a separate directory on HDFS. You can use the Hive or Big SQL ALTER TABLE… ADD PARTITION command to add entire partition directories if the data is already on HDFS. Or the MSCK REPAIR TABLE command can be used from Hive instead of the ALTER TABLE … ADD PARTITION command. For example, you can use the following Big SQL commands to add the new partition 2017_part to an existing t1_part table:


jsqsh> CREATE EXTERNAL HADOOP TABLE t1_part
    (c1 int, c2 int)
	partitioned by (year_part int)
    ROW FORMAT DELIMITED FIELDS TERMINATED BY ','
    LOCATION '/user/hadoop/t1_part';

$hadoop fs -mkdir '/user/hadoop/t1_part/2017_part'
$hadoop fs -put 2017.txt '/user/hadoop/t1_part/2017_part’

jsqsh> ALTER TABLE t1_part  ADD PARTITION (year_part='2017') location ‘/user/hadoop/t1_part/2017_part'

The alter table can also be done from Hive using the same syntax. The HCAT_CACHE_SYNC stored procedure will need to be executed from Big SQL so that the partition can be immediately accessible. If the table was created and partitions were added from Hive, the following commands would be executed:


hive> CREATE TABLE t1_part
    (c1 int, c2 int)
	partitioned by (year_part int)
    ROW FORMAT DELIMITED FIELDS TERMINATED BY ','
    LOCATION '/user/hadoop/t1_part';

$hadoop fs -mkdir '/user/hadoop/t1_part/2017_part'
$hadoop fs -put 2017.txt '/user/hadoop/t1_part/2017_part’

hive > ALTER TABLE t1_part  ADD PARTITION (year_part='2017') location ‘/user/hadoop/t1_part/2017_part'
–-Tell the Big SQL Scheduler to refresh its cache for table t1_part
jsqsh>  CALL SYSHADOOP.HCAT_CACHE_SYNC (‘bigsql’,’t1_part’);

An alternative to using the ALTER TABLE…ADD PARTITION command is to create the partitioning directories on HDFS and use the MSCK REPAIR TABLE command from Hive. For example, issue the MSCK REPAIR TABLE command from Hive after the directories have been created on HDFS:


hive> CREATE TABLE t1_part
    (c1 int, c2 int)
	partitioned by (year_part int)
    ROW FORMAT DELIMITED FIELDS TERMINATED BY ','
    LOCATION '/user/hadoop/t1_part';

$hadoop fs -mkdir '/user/hadoop/t1_part/2017_part'
$hadoop fs -put 2017.txt '/user/hadoop/t1_part/2017_part’
hive> MSCK REPAIR TABLE t1_part;

After issuing the command above, Hive will be made aware of the added partitioning directories. Big SQL will need to be made aware of the new partition by issuing an additional stored procedure call:


–-Tell the Big SQL Scheduler to refresh its cache for table t1_part
jsqsh> CALL SYSHADOOP.HCAT_CACHE_SYNC (‘bigsql’,’t1_part’);

Summary

This blog outlined the ingestion technique of adding files directly to HDFS and informing Big SQL of these files. This technique can offer very fast ingestion into Hadoop.

Percona XtraDB Cluster 5.6.37-26.21 is Now Available

$
0
0

Feed: Percona Database Performance Blog.
Author: Alexey Zhebel.

 | September 20, 2017 | 
Posted In: Events and Announcements, High-availability, MySQL, Percona Software, Percona XtraDB Cluster, ProxySQL

PREVIOUS POST

Percona XtraDB Cluster 5.6.34-26.19Percona announces the release of Percona XtraDB Cluster 5.6.37-26.21 on September 20, 2017. Binaries are available from the downloads section or our software repositories.

Percona XtraDB Cluster 5.6.37-26.21 is now the current release, based on the following:

All Percona software is open-source and free.

Improvements

  • PXC-851: Added version compatibility check during SST with XtraBackup:
    • If donor is 5.6 and joiner is 5.7: A warning is printed to perform mysql_upgrade.
    • If donor is 5.7 and joiner is 5.6: An error is printed and SST is rejected.

Fixed Bugs

  • PXC-825: Fixed script for SST with XtraBackup (wsrep_sst_xtrabackup-v2) to include the --defaults-group-suffix when logging to syslog. For more information, see #1559498.
  • PXC-827: Fixed handling of different binlog names between donor and joiner nodes when GTID is enabled. For more information, see #1690398.
  • PXC-830: Rejected the RESET MASTER operation when wsrep provider is enabled and gtid_mode is set to ON. For more information, see #1249284.
  • PXC-833: Fixed connection failure handling during SST by making the donor retry connection to joiner every second for a maximum of 30 retries. For more information, see #1696273.
  • PXC-841: Added check to avoid replication of DDL if sql_log_bin is disabled. For more information, see #1706820.
  • PXC-853: Fixed cluster recovery by enabling wsrep_ready whenever nodes become PRIMARY.
  • PXC-862: Fixed script for SST with XtraBackup (wsrep_sst_xtrabackup-v2) to use the ssl-dhparams value from the configuration file.

Help us improve our software quality by reporting any bugs you encounter using our bug tracking system. As always, thanks for your continued support of Percona!

PREVIOUS POST

Alexey Zhebel

Alexey works for Percona as a Technical Writer responsible for open source software documentation. He joined the company in March 2015 with almost 8 years of prior experience in writing and managing technical documentation. Before joining Percona, Alexey worked for Oracle on Java SE and Java ME documentation. And before that his writing experience revolved around virtualization and information security software. Alexey has a degree in Electrical Engineering and a supplementary qualification in translation theory (Russian-English). He lives in Saint Petersburg, Russia with his wife and son. He spends his free time practicing and playing ultimate frisbee in a local team.

The MySQL 8.0.3 Release Candidate is available

$
0
0

Feed: Planet MySQL
;
Author: Geir Hoydalsvik
;

The MySQL Development team is very happy to announce that MySQL 8.0.3, the first 8.0 Release Candidate (RC1), is now available for download at dev.mysql.com (8.0.3 adds features to 8.0.2, 8.0.1 and 8.0.0). The source code is available at GitHub. You can find the full list of changes and bug fixes in the 8.0.3 Release Notes. Here are the highlights. Enjoy!

Histograms

Using histogram statistics in the optimizer (WL#9223) – This work by Erik Froseth makes use of histogram statistics in the optimizer. The primary use case for histogram statistics is for calculating the selectivity (filter effect) of predicates of the form “COLUMN operator CONSTANT”.  Optimizer statistics are available to the user through the INFORMATION_SCHEMA.COLUMN_STATISTICS table.

Force Index

FORCE INDEX to avoid index dives when possible (WL#6526) – This work by Sreeharsha Ramanavarapu allows the optimizer to skip index dives in queries containing FORCE INDEX. An index dive estimates the number of rows. These estimates are used to decide the choice of index. When FORCE INDEX has been specified, this estimation is irrelevant and can be skipped. This applies to a single-table query during execution if FORCE INDEX applies to a single index, without sub-queries, without  fulltext index, without GROUP-BY or DISTINCT clauses, and without ORDER-BY clauses.

This optimization applies to range queries and ref. queries, for example a range query like: SELECT a1 FROM t1 FORCE INDEX(idx) WHERE a1 > 'b';. In these cases, an EXPLAIN FOR CONNECTION FORMAT=JSON will output "skip_records_in_range_due_to_force": true and an optimizer trace will output "skipped_due_to_force_index".

Hints

Hint to temporarily set session variable for current statement (WL#681) – This work by Sergey Glukhov implements a new optimizer hint called SET_VAR.  The SET_VAR hint will set the value for a given system variable for the next statement only. Thus the value will be reset to the previous value after the statement is over. SET_VAR covers a subset of sessions variables, since some session variables either do not apply to statements or must be set at an earlier stage of statement execution. Some variable settings have much more meaning being set for a query rather than for a connection, for example you might want to increase sort_buffer_size before doing a large sort query but it is very likely other queries in a session are simple and you are quite OK with default settings for  those. E.g. SELECT /*+ SET_VAR(sort_buffer = 16M) */ name FROM people ORDER BY name;

Invisible Indexes

Optimizer switch to see invisible indexes (WL#10891) – This work by Martin Hansson implements an optimizer_switch named use_invisible_indexes which can be turned ON or OFF (default).  Optimizer switches can be activated on a per session basis by SET @@optimizer_switch='use_invisible_indexes=on'; This feature supports the use case where a user wants to roll out an index.  For example, the user may want to create the index as invisible and then activate the index in a specific session to measure the effect.

Common Table Expressions

Limit recursion in CTE (WL#10972) – This work by Guilhem Bichot implements a global and session variable called  cte_max_recursion_depth to limit recursion in CTEs (default 1000, min 0, max 4G).  This is done to protect the users from runaway queries, for example if the user forgets to add a WHERE clause to the recursive query block. When a recursive CTE does more than cte_max_recursion_depth iterations, the execution will stop and return an error message.

Character Sets

Add Russian collations for utf8mb4 (WL#10753) – This work by Xing Zhang adds Russian collations utf8mb4_ru_0900_ai_ci and utf8mb4_ru_0900_as_cs for character set utf8mb4. The new collations sort characters of Russian language according to language specific rules defined by Unicode CLDR.

JSON

Add JSON_MERGE_PATCH, rename JSON_MERGE to JSON_MERGE_PRESERVE (WL#9692) – This work by Knut Anders Hatlen implements two alternative JSON merge functions, JSON_MERGE_PATCH() and JSON_MERGE_PRESERVE().

The JSON_MERGE_PATCH() function implements the semantics of JavaScript (and other scripting languages) specified by RFC7396, i.e. it removes duplicates by precedence of the second document. For example, JSON_MERGE('{"a":1,"b":2 }','{"a":3,"c":4 }'); # returns {"a":3,"b":2,"c":4}.

The JSON_MERGE_PRESERVE() function has the semantics of JSON_MERGE() implemented in MySQL 5.7 which preserves all values, for example  JSON_MERGE('{"a": 1,"b":2}','{"a":3,"c":4}'); # returns {"a":[1,3],"b":2,"c":4}.

The existing JSON_MERGE() function is deprecated in MySQL 8.0 to remove ambiguity for the merge operation. See also proposal in Bug#81283.

GIS

Support SRID in InnoDB Spatial Index (WL#10439) – This work by Elzbieta Babij makes InnoDB Spatial Indexes aware of the Spacial Reference System (SRS) of the indexed column.  The geography support in 8.0 needs to compare geometries using different formulas depending upon the SRS. Therefore, the index must know which SRS it is in in order to work correctly. When a spatial index is created  InnoDB will do a sanity check that SRID for all rows are of the same type as specified by column. See Argument Handling by Spatial Functions.

Ellipsoidal R-tree support functions (WL#10827) – This work by Norvald Ryeng reimplements the R-trees support functions for Minimum Bounding Rectangles (MBR) operations in a way that supports both Cartesian and geographical computations. R-tree indexes on columns with Cartesian geometries use Cartesian computations, and R-tree indexes on columns with geographic geometries use geographic computations. If an R-tree contains a mix of Cartesian and geographic geometries, or if any geometries are invalid, the result of any operation on that index is undefined.

SRID type modifier for geometric types (WL#8592) – This work by Erik Froseth adds a new column property for geometric types to specify the SRID. For example SRID 4326 in CREATE TABLE t1 (g GEOMETRY SRID 4326, p POINT SRID 0 NOT NULL);. Values inserted into a column with an SRID property must be in that SRID. Attempts to insert values with other SRIDs results in an exception condition being raised. Unmodified types, i.e., types with no SRID specification, will continue to accept all SRIDs as before. The optimizer is changed so that only indexes on columns with the SRID specified will be considered in query planning/execution. The specified SRID is exposed in both INFORMATION_SCHEMA.GEOMETRY_COLUMNS and INFORMATION_SCHEMA.COLUMNS.

Resource Groups

Resource Groups (WL#9467) – This work by Thayumanavar Sachithanantha introduces global Resource Groups to MySQL. The purpose of Resource Groups is to decide on the mapping between user/system threads and CPUs. This can be used to split workloads across CPUs to obtain better efficiency and/or performance in some use cases. There are two default groups, one for user threads and one for system threads. Both default groups have 0 priority and no CPU affinity. DevOps/DBAs can create and manage additional Resource Groups with priority and CPU affinity using SQL CREATE/ALTER/DROP RESOURCE GROUP. Information about existing resource groups are found in INFORMATION_SCHEMA.RESOURCE_GROUPS. The user can execute a SQL query on a given resource group by adding the hint /*+ RESOURCE_GROUP(resource_group_name) */  after the initial SELECT, UPDATE, INSERT, REPLACE or DELETE keyword.

Performance Schema

Digest Query Sample (WL#9830) – This work by Christopher Powers makes some changes to the EVENTS_STATEMENTS_SUMMARY_BY_DIGEST performance schema table to capture a full example query and some key information about this query example. The column QUERY_SAMPLE_TEXT is added to capture a query sample so that users can run EXPLAIN on a real query and to get a query plan. The column QUERY_SAMPLE_SEEN is added  to capture the query sample timestamp. The column QUERY_SAMPLE_TIMER_WAIT is added to capture the query sample execution time. The columns FIRST_SEEN and LAST_SEEN  have been modified to use fractional seconds.

Instrumentation meta-data (WL#7801) – This work by Marc Alff adds meta-data for instruments in performance schema table SETUP_INSTRUMENT. Meta-data act as online documentation, to be looked at by users or tools. It adds columns for “properties”, “volatility”, and “documentation”.

Service for componets (WL#9764) – This work by Marc Alff exposes the existing performance schema interface as a service which can be consumed by components in the new service infrastructure. With this work, code compiled as a component (not as a “plugin”) can invoke the performance schema instrumentation.

Security

Caching sha2 authentication plugin (WL#9591) – This work by Harin Vadodaria introduces a new authentication plugin, caching_sha2_password, which uses a caching mechanism to speed up authentication.

A password is created (CREATE/ALTER USER) over a TLS protected connection.  The server does multiple rounds of SHA256(password) with SALT and stores the “expensive” HASH in mysql.user.authentication_string. Note that only the expensive HASH is stored on server side, not the password. Then the “new user” initiates a authentication and gets a random number back from the server. The client sends a HASH based on this random number and the user provided password back to the server. The server then tries to verify the received HASH against the cached entry. If it is in the cache the authentication is ok, but the first time the user connects it will not be in the cache.

When the entry is not in the cache a full “expensive authentication” takes place: The client sends password on a TLS connection or encrypts the password using RSA keypair (password never sent without encryption). The server decrypts the password and creates the expensive HASH and compares it with mysql.user.authentication_string. If there is no match the server returns an error to the client, otherwise it creates a fast HASH and stores it in cache entry : ‘user’@’host’ -> SHA256(SHA256(password)) and returns ok back to the client. The next time the user is authenticated it will be fast since it will find the entry in the cache.

Password rotation policy (WL#6595) – This work by Georgi Kodinov introduces restrictions on password reuse. Restrictions can be configured at global level as well as individual user level. Password history is kept secure because it may give clues about habits or patterns used by individual users when they change their password. As previously, MySQL offers a password expiration policy which enforces password change based on time. MySQL also has the ability to control what can and can not be used as password. This work restrict password reuse and thus forces users to supply new strong passwords with each password change.

Retire skip-grant-tables (WL#4321) – This work by  Kristofer Älvring disallows remote connections when the server is started with –skip-grant-tables.  See also Bug#79027 reported by Omar Bourja.

Protocol

Make metadata information transfer optional (WL#8134) – This work by Ramil Kalimullin adds an option to turn off metadata generation and transfer for resultsets. Constructing/parsing and sending/receiving resultset metadata consumes server, client and network resources. In some cases the metadata size can be much bigger than actual result data size and the metadata is just not needed. We can significantly speed up the query result transfer by completely disabling the generation and storage of these data. This work introduces a new session variable called resultset_metadata which can either be FULL (default) or NONE. Clients can set the CLIENT_OPTIONAL_RESULTSET_METADATA flag if they do not want meta data back with the resultset. There are no protocol changes for clients that don’t set the CLIENT_OPTIONAL_RESULTSET_METADATA, such clients will operate as before.

Service Infrastructure

Component status variables as a service for mysql_server component (WL#10806) – This work by Venkata Sidagam provides a status variable service to components by the mysql_server component. The components can register, unregister, and get_variable to handle their own status variables. The component status variables will be added as status variables to the global names space of status variables.

Configuration system variables as a service for mysql_server component (WL#9424) – This work by Venkata Sidagam provides a system variable service to components by the mysql_server component. The components can register, unregister, and get_variable to handle their own system variables. The component system variables will be added as status variables to the global names space of system variables.

X Protocol / X Plugin

mysqlx.Crud.Update with MERGE_PATCH (WL#10797) – This work by Lukasz Kotula adds an operation type called MERGE_PATCH to the X Protocol Mysqlx.Crud.Update message. When the X Plugin handles the Mysqlx.Crud.Update message it uses the JSON_MERGE_PATCH() function in the server to modify documents. A document patch expression contains instructions about how the source document is to be modified producing a derived document.  Document patches are represented as Mysqlx.Expr.Expr objects, as already defined in the X protocol.  SQL mapping takes advantage of the JSON_MERGE_PATCH() function, which has the desired semantics for merging a “patch” document against another JSON document. In short, the mapping takes the form of: @result = JSON_MERGE_PATCH(source, @patch_expr) where @patch_expr is the expression generated for the patch object.

Mysqlx.Crud.Update on top level document  (WL#10682) – This work by Grzegorz Szwarc modifies the existing Mysqlx.Crud.Update operation in the X Protocol / X Plugin. With this change the update operations (ITEM_REMOVE, ITEM_SET, ITEM_REPLACE, ARRAY_INSERT, ARRAY_APPEND) allow an empty document path to be specified. An empty document-path means that the update operates on the whole document.  In other words, all operations that are executed through Mysqlx.Crud.Update can now operate on whole/root document. Any operation done on an existing document will preserve  the existing Document ID.

Mysqlx.Crud.Find with row locking  (WL#10645) – This work by Tomasz Stepniak adds a “locking” field to the Mysqlx.Crud.Find message. The X Plugin interprets the value under “locking” to activate the innodb locking functionality. There are three cases possible: 1) “locking” field was not specified, the interpretation of the message is the same as in old plugin (no locking activated). 2) “locking” was set to “SHARED_LOCK”, the interpretation of the message adds “LOCK IN SHARE MODE” to the generated SQL (triggering the innodb  locking functionality), and 3) “locking” was set to “EXCLUSIVE_LOCK”, the interpretation of the message adds “FOR UPDATE” to the generated SQL (triggering the innodb locking functionality).

Spatial index type  (WL#10734) – This work by Grzegorz Szwarc adds support for spatial indexes on GeoJSON data stored in JSON documents. Geographical coordinates in a document collection are represented in the GeoJSON format. GeoJSON data is converted to the GEOMETRY datatype by the X Plugin. GEOMETRY datatypes can be indexed by spatial indexes.

Full-Text index type  (WL#10744) – This work by Grzegorz Szwarc makes adds support for Full-Text indexes on Documents. Full-Text indexes allows searching the entire document (or a sub-document) for any text value.

X Protocol expectations for supported protobuf fields  (WL#10237) – This work by Lukasz Kotula introduces a new “condition key” to the X Protocol expectation mechanism. The client is going to send an “Expect Open” message containing message/fields tag chain and the server is going to validate if the field specified this way is present inside the definition of servers X Protocol message. This is done to ensure pipelining, message processing should be stopped when any message does not meet the expectation. This functionality helps to detect compatibility problems between the client application and the MySQL Server, when the server receives an X Protocol message containing a field that it doesn’t know.

X Protocol connector code extraction from mysqlxtest to libmysqlxclient  (WL#9509) – This work by Lukasz Kotula implements a low level client/connector library that is going to be used by both internal and external components to connect to MySQL Server using the X Protocol. Hence the libmysqlxclient plays a similar role for X Protocol as libmysqlclient has done for the classic protocol.

Performance

Use CATS for scheduling lock release under high load (WL#10793) – This work by Sunny Bains implements Contention-Aware Transaction Scheduling (CATS) in InnoDB. The original patch was contributed by Jiamin Huang (Bug#84266). CATS helps in reducing the lock sys wait mutex contention by granting locks to transactions that have a higher wait in the dependency graph. The implementation keeps track of how many transactions are waiting for locks that are already acquired by a transaction and, recursively, how many transaction are waiting for those waiting transactions in the wait for graph. The waits-for-edge is “weighted” and this weight is used to order the transactions when scheduling the lock release. The weight is a cumulative weight of the dependencies.

Tablespaces

InnoDB: Stop using rollback segments in the system tablespace (WL#10583) – This work by Kevin Lewis changes the minimum value for innodb_undo_tablespaces to 2 and modifies the code that deals with rollback segments in the system tablespace so that it can read, but not create or update rollback segements in an existing system tablespace. In 8.0, rollback segements are moved out of the system tablespace and into UNDO tablespaces.

Rename a general tablespace  (WL#8972)  – This work by Dyre Tjeldvoll implements ALTER TABLESPACE s1 RENAME TO s2; A general tablespace is a user-visible entity which users can CREATE, ALTER, and DROP. See also Bug#26949, Bug#32497, and Bug#58006.

DDL

ALTER TABLE RENAME COLUMN (WL#10761) – This work by Abhishek Ranjan implements ALTER TABLE ... RENAME COLUMN old_name TO new_name;. This is an improvement over existing syntax ALTER TABLE CHANGE ... which requires re-specification of all the attributes of the column. The old/existing syntax has the disadvantage that all the column information might not be available to the application trying to do the rename. There is also a risk of accidental data type change in the old/existing syntax which might result in data loss.

Replication

Replication of partial JSON updates (WL#2955) – This work by Maria Couceiro implements an option to enable/disable partial JSON updates. If the user disables the option, the server must only write full JSON documents to the binary log, and never partial JSON updates. If the user enables the option, the server may write partial JSON updates to the after-image of Row Based Replication updates in the binary log when possible. It may also write full JSON documents, e.g. in case the server cannot generate a partial JSON update, or if the partial JSON update would be bigger than the full document.

Group Replication

Instrument threads in GCS/XCom (WL#10622) – This work by Filipe Campos instruments the GCS and XCom threads and exposes them automatically in performance schema table metrics. It is also a requirement that we do further instrumentation in XCom and GCS, such as mutexes and condition variables, as well as memory usage.

Change GCS/XCOM to have dynamic debugging and tracing (WL#10200) – This work by Alfranio Correia implements dynamical filtering for debugging and tracing messages per sub-system (i.e. GCS, XCOM, etc). Debugging can be turned on by SET GLOBAL group_replication_communication_debug_options='GCS_DEBUG_ALL';. Error, warning and information messages will be output as defined by the server’s error logging component. Debug and trace messages will sent to a file when group replication is in use. By default the file used as debug sink will be named GCS_DEBUG_TRACE and will be placed in the data directory.

Data Dictionary

Support crash-safe DDL (WL#9536) – This work by Bin Su and Jimmy Yang ensures crash-safe DDL for MySQL. This work materializes one of the main benefits of having one common transactional data dictionary for server and storage engine layers, i.e. it is no longer possible for Server and InnoDB to have different metadata for database objects.

Improve crash-safety of non-table DDL (WL#9173) – This work by  Praveenkumar Hulakund ensures crash-safety of non-table DDLs. For example CREATE/ALTER/DROP FUNCTION/PROCEDURE/EVENT/VIEW.

Implicit tablespace name should be same as table name (WL#10436)  – This work by Thirunarayanan Balathandayuth ensures that a CREATE TABLE creates an implicit tablespace with the same name. This is only for implicitly created tablespaces, the user can also create explicitly named tablespaces and create tables within explicitly named tablespaces.

Remove InnoDB system tables and modify the views of their information schema counterparts (WL#9535)  – This work by Zheng Lai removes the InnoDB internal data dictionary (SYS_* tables). Some of the INFORMATION_SCHEMA information are based on SYS_* tables, for example information_schema.innodb_sys_tables and information_schema.innodb_sys_tablespaces. These information_schema tables are replaced with views over data dictionary tables.

Integrating InnoDB SDI with new data dictionary (WL#9538)  – This work by Satya Bodapati ensures that the JSON formatted Serialized Dictionary Information (SDI) is stored in the InnoDB tablespaces. This work also assures that the SDI gets updated when meta-data are changed, e.g. because of an ALTER TABLE. There is also a tool ibd2sdi, which is able extract SDI from an InnoDB tablespace when the server  is offline.

Meta-data locking for FOREIGN KEY tables (WL#6049) – This work by  Dmitry Lenev implements meta-data locking for foreign keys. This involves acquiring metadata locks on tables across foreign key relationships so that conflicting operations are blocked as well as updating FK metadata if a parent table changes. This work is enabled by the common data dictionary which makes foreign keys visible to the server layer, thus to meta-data locking.

Implement INFORMATION_SCHEMA system views for FILES/PARTITIONS (WL#9814)  – This work by Gopal Shankar implements new system views definition for  INFORMATION_SCHEMA.PARTITIONS and INFORMATION_SCHEMA.FILES. These views read metadata directly from data dictionary tables.

Implement INFORMATION_SCHEMA.REFERENTIAL_CONSTRAINTS as a system views over dictionary tables (WL#11059) – This work by Gopal Shankar implements new system views definition for INFORMATION_SCHEMA.REFERENTIAL_CONSTRAINTS. This view reads metadata directly from data dictionary tables.

MTR Tests

Change Server General tests to run with new default charset (WL#10299) – This work by Deepa Dixit fixes MTR tests so they now run with the new default character set.

Add/Extend mtr tests for Replication/GR for roles (WL#10886) – This work by Deepthi E.S. adds MTR tests to ensure that Roles are replicated as expected. For example tests must verify that ROLES on replication users used in ‘CHANGE MASTER TO’work as expected for RPL/GR.

Add/Extend mtr tests for replication with generated columns and X plugin (WL#9776) – This work by Parveez Baig adds MTR tests to ensure that stored/virtual columns are replicated as expected. For example that replication shall not be affected when transactions involve stored or virtual columns.

Library Upgrade

Upgrade zlib libraries to 1.2.11 in trunk (WL#10551) – This work by Aditya A. upgrades the zlib library versions from zlib 1.2.3 to zlib 1.2.11 for MySQL 8.0.

Changes to Defaults

Autoscale InnoDB resources based on system resources by default (WL#9193) – This work by Mayank Prasad introduces a new option  innodb_dedicated_server which can be set OFF/ON (OFF by default). If ON, settings for following InnoDB variables (if not specified explicitly) would be scaled accordingly innodb_buffer_pool_size, innodb_log_file_size, and innodb_flush_method. See also blog post Plan to improve the out of the Box Experience in MySQL 8.0 by Morgan Tocker.

Change innodb_autoinc_lock_mode default to 2 (WL#9699) – This work by Mayank Prasad changes the default of innodb_autoinc_lock_mode from sequential (1) to interleaved (2). This can be done because the default replication format is row-based replication. This change is known to be incompatible with statement based replication, and may break some applications or user-generated test suites that depend on sequential auto increment. The previous default can be restored by setting innodb_autoinc_lock_mode=1;

Change innodb_flush_neighbors default to 0 (WL#9631) – This work by Mayank Prasad changes the default of innodb_flush_neighbors from 1 (enable) to 0 (disable). This is done because fast IO (SSDs) is now the default for deployment. We expect that for the majority of users, this will result in a small performance gain. Users who are using slower hard drives may see a performance loss, and are encouraged to revert to the previous defaults by setting innodb_flush_neighbors=1.

Change innodb_max_dirty_pages_pct_lwm default to 10 (WL#9630) – This work by Mayank Prasad changes the default of innodb_max_dirty_pages_pct_lwm from 0 (%) to 10 (%). With innodb_max_dirty_pages_pct_lwm=10, InnoDB will increase its flushing activity when >10% of the buffer pool contains modified (‘dirty’) pages. The motivation for this default change is to trade off peak throughput slightly, in exchange for more consistent performance. We do not expect the majority of users to see impact from this change, but symptomatically query throughput may be reduced after a number of sustained modifications. Users who wish to revert to the previous behavior can set innodb_max_dirty_pages_pct_lwm=0. The value of zero disables the increased flushing heuristic.

Change innodb_max_dirty_pages_pct default to 90 (WL#9707) – This work by Mayank Prasad changes the default of innodb_max_dirty_pages_pct from 75 (%) to 90 (%).  With this change, InnoDB will allow a slightly greater number of modified (‘dirty’) pages in the buffer pool, at the risk of a lower amount of free-able  space for other operations that require loading pages into the buffer pool. However in practice, InnoDB does not have the same reliance on innodb_max_dirty_pages_pct as it did in earlier versions of MySQL because of the introduction of a new low-watermark heuristic. With innodb_max_dirty_pages_pct_lwm, flushing activity increases at a much earlier point (default: 10%). Users wishing to revert to the previous behavior can set innodb_max_dirty_pages_pct=70 and innodb_max_dirty_pages_pct_lwm=0.

Change default algorithm for calculating back_log (WL#9704) – This work by Abhishek Ranjan changes the algorithm used for the back_log default which is autosize (-1). The new algorithm is simply to set back_log equal to max_connections. Default value will be capped to maximum limit permitted by range of ‘back_log’ (65535). The old algorithm  was to set back_log = 50 + (max_connections / 5).

Change max-allowed-packet compiled default to 64M (WL#8393) – This work by Abhishek Ranjan changes the default of max_allowed_packet from 4194304 (4M) to 67108864 (64M). The main advantage with this larger default is that fewer users receive errors about insert or query being larger than max_allowed_packet. Users wishing to revert to the previous behavior can set max_allowed_packet=4194304.

Change max_error_count default to 1024 (WL#9686) – This work by Abhishek Ranjan changes the default of max_error_count from 64 to 1024. The effect is that MySQL will handle a larger number of warnings, e.g. for an UPDATE statement that touches 1000s of rows and many of them give conversion warnings (batched updates). There are no static allocations, so this change will only affect memory consumption for statements that generate lots of warnings.

Enable event_scheduler by default (WL#9644)This work by Abhishek Ranjan changes the default of event_scheduler from OFF to ON. This is seen as an enabler for new features in SYS, for example “kill idle transactions”.

Enable binary log by default (WL#10470) – This work by Narendra Chauhan changes the default of –log-bin from OFF to ON. Nearly all production installations have the binary log enabled as it is used for replication and point-in-time recovery. Thus, by enabling binary log by default we eliminate one configuration step for users (enabling it later requires a mysqld restart). By enabling it by default we also get better test coverage and it becomes easier to spot performance regressions.

Enable replication chains by default (WL#10479) – This work by Ganapati Sabhahit changes the default of log-slave-updates from OFF to ON.  This causes a slave to log replicated events into its own binary log. This option ensures correct behavior in various replication chain setups, which have become the norm today. This is also required for Group Replication.

Deprecation and Removal

Remove query cache (WL#10824) – This work by Steinar Gunderson removes the query cache for 8.0. See also blog post Retiring Support for the Query Cache by Morgan Tocker. All related startup options and configuration variables are removed as well. HAVE_QUERY_CACHE will now return NO, so that well-behaved clients can check for this and behave accordingly. The SQL_NO_CACHE keyword will continue to exist, but will be ignored (no effect in the grammar). This is so that e.g. mysqldump can continue working.

Rename tx_{read_only,isolation} variables to transaction_{read_only,isolation}  (WL#9636) – This work by Nisha Gopalakrishnan removes the system variables called tx_read_only and  tx_isolation. Use transaction_read_only and transaction_isolation instead. This is done to harmonize wording with command-line format  –transaction_read_only and –transaction_isolation as well as with other transaction related system varaibles like transaction_alloc_block_size, transaction_allow_batching, and transaction_prealloc_size. See also Bug#70008 reported by Simon Mudd.

Remove log_warnings option (WL#9676) – This work by Tatjana Nurnberg removes the old log-warnings option deprecated in 5.7. Use log_error_verbosity instead.

Remove ignore_builtin_innodb option (WL#9675) – This work by Georgi Kodinov removes the old ignore_builtin_innodb options deprecated in 5.6. Even when used, these options have had no effect since MySQL 5.6.

Remove ENCODE()/DECODE() functions (WL#10788) – This work by Georgi Kodinov removes the ENCODE() and DECODE() functions deprecated in 5.7. Use AES_ENCRYPT() and AES_DECRYPT() instead.

Remove ENCRYPT(), DES_ENCRYPT(), and DES_DECRYPT() functions (WL#10789) –  This work by Georgi Kodinov removes the ENCRYPT(), DES_ENCRYPT(), and DES_DECRYPT() functions deprecated in 5.7. Use AES_ENCRYPT() and AES_DECRYPT() instead.

Remove parameter secure_auth (WL#9674) – This work by Georgi Kodinov removes the secure_auth deprecated in 5.7.   The option appears in server and clients. Even when used, these options have had no effect since MySQL 5.7. The secure-auth was used to control whether the mysql_old_password methods are allowed on the client and the server but this authentication method is now gone from both the client and the server.

Remove EXPLAIN PARTITIONS and EXTENDED options (WL#9678) – This work by Sreeharsha Ramanavarapu removes the EXTENDED and PARTITIONS keywords from EXPLAIN deprecated in 5.7. Both EXTENDED and PARTITIONS output are enabled by default since 5.7, so these keywords are superfluous and thus removed.

Remove unused date_format, datetime_format, time_format, max_tmp_tables (WL#9680) – This work by Sreeharsha Ramanavarapu removes system variables date_format, datetime_format, time_format,and max_tmp_tables. These variables have never been in use (or at least not been used in MySQL 4.1 or newer releases).

Remove multi_range_count system variable (WL#10908) – This work by Sreeharsha Ramanavarapu removes the system variable multi_range_count deprecated in 5.1. Even when used, this option has had no effect since MySQL 5.5. From MySQL 5.5 and onwards, arbitrarily long lists of ranges can be processed.

Remove the global scope of the sql_log_bin system variable (WL#10922) – This work by Luis Soares removes the global scope of the sql_log_bin system variable in MySQL 8.0. The sql_log_bin was set read only in MySQL 5.5, 5.6 and 5.7. In addition, reading this variable was deprecated in MySQL 5.7. See also Bug#67433 reported by Jeremy Cole.

Deprecate master.info and relay-log.info files (WL#6959) – This work by Luis Soares implements a deprecation warning in the server when either relay-log-info-repository or master-info-repository are set to FILE instead of TABLE. The default setting is TABLE for both options and this is also the most crash-safe setup.

Deprecate mysqlbinlog –stop-never-slave-server-id (WL#9633) – This work by Luis Soares implements a deprecation warning in the mysqlbinlog utility for the –stop-never-slave-server-id option. Use the –connection-server-id option instead.

Deprecate mysqlbinlog- -short-form (WL#9632) – This work by Luis Soares implements a deprecation warning in the mysqlbinlog utility for the –short-form option. This option is not to be used in production (as stated in the docs) and is now too overloaded to be used even when testing.

Deprecate IGNORE_SERVER_IDS when GTID_MODE=ON (WL#10963) – This work by Luis Soares implements a deprecation warning when users try to use CHANGE MASTER TO IGNORE_SERVER_IDS together with GTID_MODE=ON.  When GTID_MODE=ON, any transaction that has been applied is automatically filtered out, so there is no need for IGNORE_SERVER_IDS.

Deprecate expire_logs_days (WL#10924) – This work by Neha Kumari adds a deprecation warning when users try to set expire_logs_days. Use the new variable binlog_expire_log_seconds instead. The new variable allows users to set expire time which need not be a multiple of days. This is the better way to set the expiration time and also more flexible, it makes the system variable expire_logs_days superfluous.

That’s it for now. Thank you for using MySQL!

Query and Visualize AWS Cost and Usage Data Using Amazon Athena and Amazon QuickSight

$
0
0

Feed: AWS Big Data Blog.

If you’ve ever wondered if a serverless alternative existed for consuming and querying your AWS Cost and Usage report data, then wonder no more. The answer is yes, and this post both introduces you to that solution and illustrates the simplicity and effortlessness of deploying it.

This solution leverages AWS serverless technologies Amazon Athena, AWS Lambda, AWS CloudFormation, and Amazon S3. But it doesn’t stop there, as you can also use Amazon QuickSight, a Serverless cloud-powered business analytics service, to build visualizations and perform ad-hoc analysis of your sanitized AWS Cost and Usage report data.

Amazon Athena, what’s that?

Amazon Athena is an interactive query service that makes it easy to analyze data directly in Amazon S3 using standard SQL. It’s a Serverless platform in which there is no need to set up or manage infrastructure. Athena scales automatically—executing queries in parallel—so results are fast, even with large datasets and complex queries.

Athena exposes several API operations that allow developers to automate running queries or using services like Lambda to trigger queries in response to events in other services like S3. This solution takes advantage of these abilities and allows you to focus on running the SQL queries that yield the results you are looking for. This solution builds the components in Athena that are needed for you to run these queries, for example, building and maintaining a database and corresponding table.

So, what’s the solution?

Today, the Billing and Cost Management service writes your AWS Cost and Usage report to an S3 bucket that you designated during the time of creation. You have the option to have AWS write these files as a GZIP or ZIP file on a schedule basis. This schedule can either be hourly or daily.

The CloudFormation template that accompanies this blog post builds a Serverless environment that contains a Lambda function that takes a CUR file, unzips it in memory, removes the header row and writes the modified report to an S3 bucket.  The Lambda function writes this file into an S3 Bucket with a directory structure of “year=current-year” and “month=current-month”. For example, if a file is written for June 1st, 2017 then the Lambda function writes the file in the folder path “bucket-name/year=2017/month=06/file_name”. The S3 bucket in which the Lambda function creates the aforementioned directory structure is constructed at the time the environment is built by the CloudFormation template.

The following diagram provides an example of what you should see in the AWS Management Console after your Lambda function runs.

You might be wondering why the Lambda function writes the files in a directory structure like the following.

The Lambda function writes data in this folder structure to allow you to optimize for query performance and cost when executing queries in Athena against your transformed AWS Cost and Usage report billing data stored in S3. For example, if you wanted to run a query to retrieve all billing data for the month of June, you could run the following query:

SELECT * FROM aws_billing_report.my_cur_report where month=’06’; 

This query would only scan the folder path month=06 and return the files within that folder. This means that you only scan the data that you need, which is a smaller subset of your overall stored billing data/reports. Given that Athena only charges you for the amount data scanned (which is $5 per TB), partitioning your data allows you to reduce the cost of querying data using Athena.

The following diagram shows what that query looks like in Athena.

What happens after the Lambda function extracts, transforms, and re-writes this file? After writing the newly transformed file, the Lambda function checks Athena to see if the database “aws_billing_report” exists. If not, then the function creates it. After it’s created, the function then creates the table “my_cur_report” that is partitioned by “year” and “month”. After this table is created, the Lambda function takes the folder structure that you created in your S3 bucket and adds that folder structure to your Athena metadata store as database partitions.

Note:  Athena is not a database; it simply projects the schema that you define for your table on top of the data stored in S3. When you delete a table or database, you are deleting the metadata for the table or database in Athena. You can’t use Athena to delete your data stored in S3. For more information, see the Amazon Athena User Guide.

Things to note

This solution only processes the current and previous month’s bills. This release does not process bills written before that. Today, this solution only supports Gzipped files that are 80 MB and under 1.5 GB uncompressed. Future releases of the Lambda functions for this solution will process zipped files and Cost and Usage reports from six months prior to the current date.

Athena queries

The following table provides a step-by-step guide as to what happens in your serverless environment from start to finish.

Setting up the AWS Cost and Usage report

There are two things you must know and two things you must do in order to launch this solution successfully. First, you must know both the name of your AWS Cost and Usage report, and the name of the S3 bucket in which the reports are currently stored.

If you already have your report set up, ensure that there is a manifest file written to the /date-path folder in your reports folder. The manifest file is important because it’s a map to where the latest reports are stored. For example, if your report name is “andro-cost-n-usage-report”, the name of your bucket is “my-report-bucket” and the current month is August (in the year 2017) then the path you should check is “my-report-bucket/ andro-cost-n-usage-report/20170801-20170901”.

If you don’t have a report set up, then follow the steps in Turning on the AWS Cost and Usage Report. For Include, choose Redshift Manifest. For Enable support for, choose Redshift.

Launching the CloudFormation template

Now for the things that you must do. First, given the name of your AWS Cost and Usage report, launch the CloudFormation template that builds all the serverless components to make running queries against your billing data effortless.

Choose the same AWS Region in which your S3 bucket is located, to which AWS writes your bills. Also, I have only included options for the regions in which Athena, Lambda, and Amazon QuickSight are currently available.

Northern Virginia   Ohio
   
Ireland   Oregon  

If your billing reports are stored in a different region, then create a new report and specify a bucket that is in one of the four regions listed.

Follow the instructions in the CloudFormation wizard, using the following options, and then choose Create.

  • For CostnUsageReport, type the name of your AWS Cost and Usage report.
  • For S3BucketName, type a unique name to be given to a new S3 bucket.
  • For s3CURBucket, type the name of the bucket in which your current reports are written.

While your stack is building, a page similar to the following is displayed.

When the Status column shows CREATE_COMPLETE, you have successfully created four new Lambda functions and a S3 bucket in which your transformed bills will be stored. The first time your Lambda functions run, two folders appear in the S3 bucket:

  • year=current_year
    Stores the transformed report.
  • aws-athena-query-results
    Stores the results of the SQL queries that you run in Athena.

Adding a Lambda trigger

After you have successfully built your CloudFormation stack, you create a Lambda trigger that points to the new S3 bucket. I recommend keeping this bucket dedicated to storing AWS Cost and Usage reports.

This trigger can be created by following the steps below.

  1. Open the Lambda console.
  2. Choose Functions, and select the “aws-cost-n-usage-main-lambda-fn-A” Lambda function (don’t choose the check box beside it).
  3. Choose Trigger, Add trigger. There should not be any existing triggers.
  4. For Trigger type (the box with dotted lines), choose S3.

  1. Select the S3 bucket that you just created. For Event type, choose Object Created (All) and check the Enable trigger Choose Submit.

Resources built, trigger created… now what?

Before moving on, I recommend checking to see that all the solution components were created.

In the Lambda console, check that the following five functions were created:

  • aws-cost-n-usage-S3-lambda-fn-B
  • aws-cost-n-usage-main-lambda-fn-A
  • aws-cost-n-usage-S3-lambda-fn-B-2
  • aws-cost-n-usage-Athena-lambda-fn-C
  • aws-cost-n-usage-Athena-lambda-fn-C-2

In the S3 console, check that the bucket was created.

Your database and table are not created until your function runs for the first time. Afterward, Athena holds your database and table.

After your Athena database and table are created, you can begin running your SQL queries. Athena uses Presto with ANSI SQL support and works with a variety of standard data formats. Start by running queries against your sanitized AWS Cost and Usage report dataset.

If you choose the eye icon beside any table name in the left navigation pane, Athena executes a SELECT * FROM [table_name] limit 10; query against your entire dataset.  Or you can run the following query:

SELECT from_iso8601_timestamp(lineitem_usagestartdate) AS lineitem_usagestartdate,
        from_iso8601_timestamp(lineitem_usageenddate) AS lineitem_usageenddate,
        product_instancetype,
        count(*) AS count
FROM aws_billing_report.my_cur_report
WHERE lineitem_productcode='AmazonEC2'and (lineitem_operation LIKE '%RunInstances%'
        OR lineitem_usagetype LIKE '%BoxUsage%')
        AND lineitem_usagetype NOT LIKE 'SpotUsage%'
        AND lineitem_usagetype NOT LIKE '%Out-Bytes%'
        AND lineitem_usagetype NOT LIKE '%In-Bytes%'
        AND lineitem_usagetype NOT LIKE '%DataTransfer%'
        AND pricing_term='OnDemand'
GROUP BY  lineitem_usagestartdate,lineitem_usageenddate,product_instancetype,lineitem_usagetype
ORDER BY  lineitem_usagestartdate, product_instancetype;

Executing this query converts the LineItem_UsageStartDate and LineItem_UsageEndDate values to UTC date format. It also returns a list of On-Demand Instances with a LineItem_Operation value of RunInstances or BoxUsage. The count column provides the results of a sum of RunInstances or BoxUsage requests on the specific instance type to the left.

The results are similar to the following screenshot:

You can run far more complex queries than those listed earlier. Another thing to know is, Athena stores query results in S3 automatically. Each query that you run has a results file in CSV format (*.csv) and a metadata file (*.csv.metadata) that includes header information such as column type, etc. If necessary, you can access the result files to work with them.

This solution creates a path in the S3 bucket, with a prefix path of “aws-athena-query-results”.

Testing

If you have successfully built this solution and added the trigger to the S3 bucket in which the Billing and Cost Management service writes your AWS Cost and Usage reports, then it might be time to conduct a simple test.

Remember, this solution processes the current and previous month billing data and it does it by using the master metadata file. This file acts as a map that tells you where the latest reports are stored.

  1. In the S3 path to which AWS writes your AWS Cost and Usage Billing reports, open the folder with your billing reports. There will be either a set of folders or a single folder with a date range naming format.

  1. Open the folder with the data range for the current month. In this folder, there is a metadata file that can be found at the bottom of the folder. It has a JSON extension and holds the S3 key for the latest report.
  2. Download the metadata file. Ensure that the name of the file on your machine is the same as the version stored on your S3 bucket.
  3. Upload the metadata file to the same S3 path from which you downloaded it. This triggers the Lambda function “aws-cost-n-usage-main-lmbda-fn-A”.
  4. In the S3 bucket that you created to hold your transform files, choose the “year=” folder and then the “month=” folder that corresponds to the current month. You should see the transformed file there, with the time stamp that indicated that it was just written.

How does the solution actually work?

The Billing and Cost Management service writes your latest report to a hashed folder inside your date range folder, as shown earlier. Each time the billing system writes your latest report, it writes it to a new hashed folder, leaving the previous report behind. The result is several hashed folders, each holding a historical view of your AWS Cost and Usage data. This is all noise, redundant data.

So that you can know where the latest data lives, AWS writes a master metadata file that contains the S3 keys and hashed folder for the latest report. This solution uses that master metadata file to ensure that the latest report is being processed, which helps sift through the multiple historical versions.

This is how the solution works. When a new report is written to the S3 bucket that is designated to store your report, S3 does a pull request for your main Lambda function. This function checks the key to ensure that it is indeed the master metadata file. If it is, then the main Lambda function decides whether the report being processed is for the current or previous month.

If it matches either, the main Lambda function calls functions B or B-2. Lambda function B processes the current month’s report, while B2 processes the previous month’s report. Separating the operation into multiple functions allows the solution to process a virtually unlimited number of reports at the same time. This is especially important when dealing with multiple reports that are gigabytes in size. The parallelization of this operation helps to overcome the time constraint of Lambda.

Lambda functions B and B2 stream your report, GUnzip each chunk of data, and remove unwanted rows that may cause an exception to be thrown when you execute a SQL query in Athena against this data. They then leverage the multipart upload capability of S3 to write the unzipped version of your file to the new S3 bucket that stores your transformed report.

During this event, Lambda function C creates your Athena database (IF NOT EXISTS) and uses the column title row in your report to create an Athena table.

Amazon QuickSight visualizations

After you have successfully built your Athena database, you have the option to integrate it with Amazon QuickSight, a BI tool/ fast business analytics service that allows you to build visualizations, perform ad hoc analysis, and quickly get business insights from your data. It seamlessly discovers AWS data sources, including but not limited to S3, Athena, Amazon Redshift, and Amazon RDS. Amazon QuickSight provides tools and filters that gives you the ability to dive deep into your dataset and pull out the data that satisfies your use case.

In this section, I walk through how to connect Amazon QuickSight to your Athena database and table to re-create the example visualization for your very own. If you are new to Amazon QuickSight, sign up for free at https://quicksight.aws.

In the following screenshot, Amazon QuickSight has been used to create several visualizations that provide the monthly total spend on AWS services, the daily spend, a monthly spend broken down by AWS service, and monthly spend by EC2 instance type. You have the ability to create visualizations like these and more.

To create reports like these, first specify how Amazon QuickSight should access your data by creating a dataset.

To get started, point Amazon QuickSight to your Athena database. Follow the steps in Creating a Data Set Using Amazon Athena Data. Type the name of your Athena database (aws_billing_report) and then the table (my_cur_report). To preview the data and apply additional transformations to your billing dataset, choose Edit/Preview data. Under tables, choose Switch to custom SQL tool, Query.

The AWS Cost and Usage report contains many columns, not all of which are necessary for your analysis and dashboard. Using a custom SQL query, you can choose which columns to use from within Amazon QuickSight. This is very useful, especially when working with Athena.

Athena uses Hive DDL to create tables, using a specified SerDe. This solution uses the OpenCSV SerDe, which means that all data returned by an Athena query is returned as “string”. The ability to run SQL queries in Amazon QuickSight before you create your visualizations provides the added advantage of converting/casting certain fields into the data type. The following SELECT statement is a perfect example, by casting bill_billingperiodstartdate from string to UTC timestamp, so that you can create a visualization that specifies a time period.

SELECT from_iso8601_timestamp(bill_billingperiodstartdate) AS bill_billingperiodstartdate,
         from_iso8601_timestamp(bill_billingperiodenddate) AS bill_billingperiodenddate,
         from_iso8601_timestamp(lineItem_UsageStartDate) AS lineItem_UsageStartDate,
         from_iso8601_timestamp(lineItem_UsageEndDate) AS lineItem_UsageEndDate,
         identity_LineItemId,
         identity_TimeInterval,
         bill_InvoiceId,
         bill_BillingEntity,
         bill_BillType,
         bill_PayerAccountId,
         lineItem_UsageAccountId,
         lineItem_ProductCode,
         lineItem_UsageType,
         lineItem_Operation,
         lineItem_AvailabilityZone,
         lineItem_UsageAmount,
         lineItem_NormalizationFactor,
         lineItem_NormalizedUsageAmount,
         lineItem_CurrencyCode,
         lineItem_UnblendedRate,
         lineItem_BlendedRate,
         lineItem_BlendedCost,
         lineItem_TaxType,
         product_ProductName,
         product_databaseEdition,
         product_databaseEngine,
         product_dedicatedEbsThroughput,
         product_deploymentOption,
         product_instanceFamily,
         product_instanceType,
         product_productFamily,
         product_storage,
         product_storageClass,
         product_usagetype,
         product_usageFamily,
         product_volumeType
FROM aws_billing_report.my_cur_report 

To start visualizing your billing data, choose Finish, Save, and Visualize.

Amazon QuickSight makes it easy for you to construct different views of your AWS Cost and Usage report. For example, you can create a KPI visualization that tracks the month-to-date spending, a time series chart of daily spend for the last two weeks, and a usage breakdown by service or features, all using the point-and-click UI. Within a few minutes, you can create a comprehensive dashboard of your AWS bill that you can use to keep track of your usage on a daily basis. You can also easily share the dashboard with others in your organization.

Conclusion

In this walkthrough, you successfully created a new S3 bucket and built a Lambda function (written in Node.js) to extract, transform, and write your billing report to an S3 folder structure that looks like a database partition to Athena. You also created a database and table in Athena. You are now ready to run standard ANSI SQL queries against your AWS Cost and Usage report billing data. You won’t see any data in your newly created S3 bucket until your Lambda function is triggered.

If you have questions or suggestions, please comment below.


About the Author

Androski Spicer has been a Solution Architect with Amazon Web Services the past two and half years. He works with customers to ensure that their environments are architected for success and according to AWS best practices. In his free time he can be found cheering for Chelsea FC, Seattle Sounders, Portland Timbers or the Vancouver Whitecaps.

Shaun M. Thomas: PG Phriday: pglogical and Postgres 10 Partitions

$
0
0

Feed: Planet PostgreSQL.

During the Postgres Open 2017 conference in San Francisco, someone came to the 2ndQuadrant booth and struck up a conversation with me. During our shameless geeking out over database mechanics, he asked me if pglogical supported the new Postgres 10 partitions. Given my noted expertise in all things Postgres, I answered in the appropriate manner:

“I have no idea. I’ll have to look into that.”

Well, after a bit of experimentation, I have a more concrete answer, and it’s reassuringly positive.

Given a table on a provider node, is it possible to capture only INSERT traffic such that it accumulates on a subscribed system for archival purposes? It’s a fairly common tactic, and allows an active OLTP system to regularly purge old data, while a reporting OLAP system keeps it available in posterity.

To get this experiment going, it’s necessary to begin with a regular table that might fit this model.

CREATE TABLE sensor_log (
  id            SERIAL PRIMARY KEY NOT NULL,
  location      VARCHAR NOT NULL,
  reading       BIGINT NOT NULL,
  reading_date  TIMESTAMP NOT NULL
);
 
INSERT INTO sensor_log (location, reading, reading_date)
SELECT s.id % 1000, round(random() * 100),
       CURRENT_DATE + INTERVAL '1d' - ((s.id * 10)::TEXT || 's')::INTERVAL
  FROM generate_series(1, 1000000) s(id);
 
CREATE EXTENSION pglogical;
 
SELECT pglogical.create_node(
    node_name := 'prod_sensors',
    dsn := 'host=localhost port=5434 dbname=phriday'
);
 
SELECT pglogical.create_replication_set(
    set_name := 'logging',
    replicate_insert := TRUE, replicate_update := FALSE,
    replicate_delete := FALSE, replicate_truncate := FALSE
);
 
SELECT pglogical.replication_set_add_table(
    set_name := 'logging', relation := 'sensor_log', 
    synchronize_data := TRUE
);

There’s nothing really surprising here. We create the table, install pglogical, and register the node itself. Next, we create a replication set that captures only INSERT activity. Why just inserts? It’s probably safe to also include UPDATE actions, but for the sake of this demonstration, we have a write-only ledger-style table.

After creating the new replication set, we just need to add any table(s) that fit that insert model. While pglogical provides a default_insert_only replication set that does this for us, we find it’s generally better to be explicit to avoid any unintended (and unexpected) magic.

With the provider properly configured, all that remains is to set up the subscriber node. This is very similar to setting up the provider node: create table, install pglogical, create subscription. We can do that now:

CREATE TABLE sensor_log (
  id            INT PRIMARY KEY NOT NULL,
  location      VARCHAR NOT NULL,
  reading       BIGINT NOT NULL,
  reading_date  TIMESTAMP NOT NULL
);
 
CREATE EXTENSION pglogical;
 
SELECT pglogical.create_node(
    node_name := 'sensor_warehouse',
    dsn := 'host=localhost port=5435 dbname=phriday'
);
 
SELECT pglogical.create_subscription(
    subscription_name := 'wh_sensor_data',
    replication_sets := array['logging'],
    provider_dsn := 'host=localhost port=5434 dbname=phriday'
);
 
SELECT pg_sleep(10);
 
SELECT COUNT(*) FROM sensor_log;
 
  COUNT  
---------
 1000000

Once again, we err on the side of caution and do a couple of things manually that may not necessarily be entirely necessary. By that, we mean manually creating the sensor_log table on the subsriber node.

The create_subscription function has a parameter called synchronize_structure to skip the table-creation step. On the other hand, it uses pg_dump to obtain table structure DDL, so the import might fail if recipient database isn’t empty. We can skip that whole dance by not using the parameter at all.

Once we’ve verified the one-million sample rows have transferred, our job is done, right?

Well, almost. There’s still time to be fancy. While we have proven it’s possible to capture only inserted data, Postgres 10 table partitions are still an unknown quantity in this relationship. It turns out, their implementation under the hood is an extremely relevant detail.

To see just how, we need to tear down the subscription and drop the recipient table on the subscriber:

SELECT pglogical.drop_subscription(
    subscription_name := 'wh_sensor_data'
);
 
DROP TABLE sensor_log;

Don’t worry, our sensor_log table will be back, and better than ever.

We only inserted one million rows into the provider node’s copy of sensor_log. As it turns out, the dates we generated don’t even exit 2017. That’s fine though, because with Postgres 10 partitions, even a single partition is sufficient to demonstrate the process.

Let’s start with a single table partitioned by the reading_date column:

CREATE TABLE sensor_log (
  id             SERIAL,
  location       VARCHAR NOT NULL,
  reading        BIGINT NOT NULL,
  reading_date   TIMESTAMP NOT NULL
)
PARTITION BY RANGE (reading_date);
 
CREATE TABLE sensor_log_part_2017
PARTITION OF sensor_log
FOR VALUES FROM ('2017-01-01') TO ('2018-01-01');
 
CREATE UNIQUE INDEX udx_sensor_log_2017_sensor_log_id ON sensor_log_part_2017 (sensor_log_id);
CREATE INDEX idx_sensor_log_2017_location ON sensor_log_part_2017 (location);
CREATE INDEX idx_sensor_log_2017_date ON sensor_log_part_2017 (reading_date);

We lament the inability to use the LIKE syntax to copy any placeholder indexes on the root table, but maybe that’ll show up in Postgres 11 or 12. Regardless, we now have one partitioned table backed by a single partition.

This is where the fun starts! All we need to do is recreate the subscription, and the sensor_log table data should be redirected into the 2017 partition, thus proving pglogical works with Postgres 10 partitions.

Let’s try it out:

SELECT pglogical.create_subscription(
    subscription_name := 'wh_sensor_data',
    replication_sets := array['logging'],
    provider_dsn := 'host=localhost port=5434 dbname=phriday'
);
 
SELECT pg_sleep(10);
 
SELECT COUNT(*) FROM sensor_log;
 
 COUNT 
-------
     0
 
SELECT pglogical.drop_subscription(
    subscription_name := 'wh_sensor_data'
);

Wait, what’s going on here? Why isn’t the table being copied at all? Let’s see what the logs have to say…

2017-09-18 14:36:03.065 CDT [4196] LOG:  starting receiver for subscription wh_sensor_data
2017-09-18 14:36:03.111 CDT [4196] ERROR:  pglogical target reation "public.sensor_log" is not a table

Oh…

It just so happens that Postgres partitioned tables aren’t actually tables. They’re more of a table-like structure that allow certain database operations to target the underlying partitions. We can even see this for ourselves by checking out the pg_class system catalog table:

SELECT relname, relkind
  FROM pg_class
 WHERE relname LIKE 'sensor_log%';
 
       relname        | relkind 
----------------------+---------
 sensor_log           | p
 sensor_log_id_seq    | S
 sensor_log_part_2017 | r

The relkind column tells us which type of object we’re looking at. Normal tables in Postgres are usually marked ‘r’ for relation. The sensor_log table on the subscriber however, shows ‘p’ for partitioned table. That actually matters, because only relations can store data. When pglogical sees that the partitioned table isn’t a relation, it refuses to continue.

Pglogical’s decision to refuse to insert into sensor_log isn’t unique. Had we attempted this experiment with Postgres 10’s new PUBLICATION / SUBSCRIPTION logical replication system, we would get the same result. Not even Postgres 10’s built-in logical replication is compatible with partitioned tables; they’re just too new.

Despite implementation details causing a bit of a non-intuitive roadblock, there’s a way around this: we cheat. Unlike Postgres 10’s built-in logical replication, pglogical exposes advanced API hooks. One of those is the Postgres Server Programming Interface.

The default behavior of logical decoding is to try and match the Postgres internal objects to prevent structural incompatibilities. As such, it matters that sensor_log isn’t a relation; it’s ultimately ephemeral, and can’t store the same data.

But what if pglogical could convert the logical decoding into literal INSERT statements instead? Well, the pglogical documentation tells us we can do that by setting these parameters in postgresql.conf:

pglogical.conflict_resolution = false
pglogical.use_spi = true

The first disables conflict resolution. We don’t really need that on the subscriber, since it’s simply receiving a stream of inserts. Then we enable the SPI process which converts the logical decoding directly into actual INSERT statements.

If we try the subscription again, we should see our expected result:

SELECT pglogical.create_subscription(
    subscription_name := 'wh_sensor_data',
    replication_sets := array['logging'],
    provider_dsn := 'host=localhost port=5434 dbname=phriday'
);
 
SELECT pg_sleep(10);
 
SELECT COUNT(*) FROM sensor_log;
 
  COUNT  
---------
 1000000
 
SELECT COUNT(*) FROM sensor_log_part_2017;
 
  COUNT  
---------
 1000000

So not only has the partition system worked, we didn’t need any triggers as with previous attempts to implement this model. Postgres 10 worked as advertised, and it’s still a beta build at the time of this writing.

While it’s unfortunate we had to jump through a couple of odd hoops to reach our intended destination, we still arrived intact. What’s more, we can see that though Postgres 10 does offer internal logical replication, it’s still an evolving feature that isn’t quite complete yet.

Postgres 11, 12, and future versions will slowly fill those cracks as patches are incorporated. In the meantime, pglogical will continue to leverage the EXTENSION system to add advanced features that Postgres core isn’t quite ready to absorb. And indeed, redirecting logical replication into a partition is a somewhat advanced use case.

I’ve always loved the Postgres EXTENSION system; augmenting Postgres functionality with things like pglogical ensures that even difficult edge cases often have a workable solution.


Percona XtraDB Cluster 5.7.19-29.22 is now available

$
0
0

Feed: Percona Database Performance Blog.
Author: Alexey Zhebel.

 | September 22, 2017 | 
Posted In: Events and Announcements, High-availability, MySQL, Percona Software, Percona XtraDB Cluster, ProxySQL

PREVIOUS POST

Percona XtraDB Cluster 5.7Percona announces the release of Percona XtraDB Cluster 5.7.19-29.22 on September 22, 2017. Binaries are available from the downloads section or our software repositories.

NOTE: You can also run Docker containers from the images in the Docker Hub repository.

Percona XtraDB Cluster 5.7.19-29.22 is now the current release, based on the following:

All Percona software is open-source and free.

Upgrade Instructions

After you upgrade each node to Percona XtraDB Cluster 5.7.19-29.22, run the following command on one of the nodes:

Then restart all nodes, one at a time:

New Features

  • Introduced the pxc_cluster_view table to get a unified view of the cluster. This table is exposed through the performance schema.

  • PXC-803: Added support for new features in Percona XtraBackup 2.4.7:

    • wsrep_debug enables debug logging
    • encrypt_threads specifies the number of threads that XtraBackup should use for encrypting data (when encrypt=1). This value is passed using the --encrypt-threads option in XtraBackup.
    • backup_threads specifies the number of threads that XtraBackup should use to create backups. See the --parallel option in XtraBackup.

Improvements

  • PXC-835: Limited wsrep_node_name to 64 bytes.
  • PXC-846: Improved logging to report reason of IST failure.
  • PXC-851: Added version compatibility check during SST with XtraBackup:
    • If a donor is 5.6 and a joiner is 5.7: A warning is printed to perform mysql_upgrade.
    • If a donor is 5.7 and a joiner is 5.6: An error is printed and SST is rejected.

Fixed Bugs

  • PXC-825: Fixed script for SST with XtraBackup (wsrep_sst_xtrabackup-v2) to include the --defaults-group-suffix when logging to syslog. For more information, see #1559498.
  • PXC-826: Fixed multi-source replication to PXC node slave. For more information, see #1676464.
  • PXC-827: Fixed handling of different binlog names between donor and joiner nodes when GTID is enabled. For more information, see #1690398.
  • PXC-830: Rejected the RESET MASTER operation when wsrep provider is enabled and gtid_mode is set to ON. For more information, see #1249284.
  • PXC-833: Fixed connection failure handling during SST by making the donor retry connection to joiner every second for a maximum of 30 retries. For more information, see #1696273.
  • PXC-839: Fixed GTID inconsistency when setting gtid_next.
  • PXC-840: Fixed typo in alias for systemd configuration.
  • PXC-841: Added check to avoid replication of DDL if sql_log_bin is disabled. For more information, see #1706820.
  • PXC-842: Fixed deadlocks during Load Data Infile (LDI) with log-bin disabled by ensuring that a new transaction (of 10 000 rows) starts only after the previous one is committed by both wsrep and InnoDB. For more information, see #1706514.
  • PXC-843: Fixed situation where the joiner hangs after SST has failed by dropping all transactions in the receive queue. For more information, see #1707633.
  • PXC-853: Fixed cluster recovery by enabling wsrep_ready whenever nodes become PRIMARY.
  • PXC-862: Fixed script for SST with XtraBackup (wsrep_sst_xtrabackup-v2) to use the ssl-dhparams value from the configuration file.

Help us improve our software quality by reporting any bugs you encounter using our bug tracking system. As always, thanks for your continued support of Percona!

PREVIOUS POST

Alexey Zhebel

Alexey works for Percona as a Technical Writer responsible for open source software documentation. He joined the company in March 2015 with almost 8 years of prior experience in writing and managing technical documentation. Before joining Percona, Alexey worked for Oracle on Java SE and Java ME documentation. And before that his writing experience revolved around virtualization and information security software. Alexey has a degree in Electrical Engineering and a supplementary qualification in translation theory (Russian-English). He lives in Saint Petersburg, Russia with his wife and son. He spends his free time practicing and playing ultimate frisbee in a local team.

MemSQL 6 Product Pillars and Machine Learning Approach

$
0
0

Feed: MemSQL Blog.
Author: Gary Orenstein.

Today marks another milestone for MemSQL as we share the details of our latest release, MemSQL 6. This release encapsulates over one year of extensive development to continue making MemSQL the best database platform for real-time analytics with a focus on real-time data warehouse use cases.

Additionally, MemSQL 6 brings a range of new machine learning capabilities to MemSQL, closing the gap between data science and operational applications.

Product Pillars

MemSQL 6 has three foundational pillars:

  • Extensibility
  • Query Performance
  • Enhanced Online Operations

Let’s explore each of these in detail.

Extensibility

Extensibility covers the world of stored procedures, user defined functions (UDFs), and user defined aggregates (UDAs). Together these capabilities represent a mechanism for MemSQL to offer in-database functions that provide powerful custom processing.

For those familiar with other databases, you may know of PL/SQL (Procedural Language/Structured Query Language) developed by Oracle, or T-SQL (Transact-SQL) jointly developed by Sybase and Microsoft. MemSQL has developed its own approach to offering similar functions with MPSQL (Massively Parallel Structured Query Language).

MPSQL takes advantage of the new code generation that was implemented in MemSQL 5. Essentially we are able to use that code generation to compile MPSQL functions. Specifically we implement native machine code for stored procedures, UDFs, and UDAs in-lined into the compiled code that we generate for a query.

Long story short, we expect MPSQL to provide a level of peak performance not previously seen with other databases’ custom functions.

MemSQL extensibility functions are also aware of our distributed system architecture. This innovation allows for custom functions to be executed in parallel across a distributed system, further enhancing overall performance.

Benefits of extensibility include the ability to centralized processes in the database across multiple applications, the performance of embedded functions, and the potential to create new machine learning functions as detailed later in this post.

Query Processing Performance

MemSQL 6 includes breakthrough improvements in query processing. One area is through operations on encoded data. MemSQL 6 includes dictionary encoding, which can translate data into highly compressed unique values that can then be used to conduct incredibly fast scans.

Consider the example of a public dataset about every airline flight in the United States from 1987 until 2015, as outlined in our blog post Delivering Scalable Self Service Analytics.

With this dataset MemSQL can encode and compress the data, allowing for extremely rapid scans of up to 1 billion rows per second per core.

MemSQL 6 also makes use of improvements to the Intel advancements with Single Instruction, Multiple Data (SIMD). This technique allows the CPU to complete multiple data operations in a single instruction, essentially vectorizing and parallel processing the query.

The benefits of these query processing advancements include having a detailed data view without needing to pre-process the data. This further allows for interactive analysis on raw, unaggregated data, providing the most up-to-date and accurate query results possible.

Enhanced Online Operations

To power mission critical applications, data platforms must be online all the time, and with MemSQL 6 we have enhanced our ability for MemSQL to operate online. This includes broader online coverage for DDL operations, and the fact that any node can perform DDL operations.

The benefits of these improvements include more sophisticated monitoring and recovery, easier application development, and improved overall availability.

Machine Learning and MemSQL 6

MemSQL 6 helps close the gap between machine learning and operational applications in three areas:

  • Built-in machine learning functions
  • Real-time machine learning scoring
  • Machine learning in SQL with extensibility

Built-in Machine Learning Functions

MemSQL 6 includes new machine learning functions like DOT_PRODUCT, which can be used for real-time image recognition but also for any application requiring the comparison of two vectors. While this function itself is not new in the world of machine learning, MemSQL now delivers this function within its distributed SQL database, enabling an unprecedented level of performance and scale.

For more information, check out this blog post, An Engineering View on Real-Time Time Machine Learning.

Real-Time Machine Learning Scoring

MemSQL includes the ability to manage real-time data pipelines with custom transformations at ingest. This transformation can also deliver the execution and scoring using a machine learning model. For example, you may choose to take a machine learning model from SAS and export it using PMML, the predictive modeling markup language.

This allows real-time scoring on ingest and co-locating the raw data and the instant score next to each other in the same row in the same table. This simple structure, sets a foundation for easy predictive analytics.

Enabling Machine Learning in SQL with Extensibility

The new MemSQL extensibility functions also enable a new approach to machine learning directly in SQL. This can dramatically shorten the gap between data science and production applications as operations occur on the live data, and models can be trained and updated to incorporate and reflect the most recent data.

We recently showcased an example of this with k-means clustering by simply using native SQL and MemSQL. You can see the presentation here on Slideshare.

Taking Machine Learning Real-Time

With the new features of MemSQL 6 including extensibility and query performance, we expect more machine learning applications to incorporate MemSQL as the persistent data store.

The MemSQL architecture is well suited to work in conjunction with other machine learning systems, and real-time data pipelines. For example, MemSQL includes:

  • A distributed, scale out architecture well suited to performance and large scale workloads
  • An open source MemSQL Spark Connector for high-throughput, highly-parallel, and bidirectional connectivity to Spark
  • Native integration with Kafka message queues including the ability to support exactly-once semantics
  • Full transactional SQL semantics so you can build production applications for the front lines of your business

Together, we see these capabilities as foundational for real-time machine learning workloads, and we invite you to try the latest version of MemSQL today at memsql.com/download.

One Million Tables in MySQL 8.0

$
0
0

Feed: Percona Database Performance Blog.
Author: Alexander Rubin.

 | October 1, 2017 | 
Posted In: InnoDB, Insight for DBAs, MySQL, MySQL 8.0

PREVIOUS POST

In my previous blog post, I talked about new general tablespaces in MySQL 8.0. Recently MySQL 8.0.3-rc was released, which includes a new data dictionary. My goal is to create one million tables in MySQL and test the performance.

Background questions

Q: Why million tables in MySQL? Is it even realistic? How does this happen?

Usually, millions of tables in MySQL is a result of “a schema per customer” Software as a Service (SaaS) approach. For the purposes of customer data isolation (security) and logical data partitioning (performance), each “customer” has a dedicated schema. You can think of a WordPress hosting service (or any CMS based hosting) where each customer has their own dedicated schema. With 10K customers per MySQL server, we could end up with millions of tables.

Q: Should you design an application with >1 million tables?

Having separate tables is one of the easiest designs for a multi-tenant or SaaS application, and makes it easy to shard and re-distribute your workload between servers. In fact, the table-per-customer or schema-per-customer design has the quickest time-to-market, which is why we see it a lot in consulting. In this post, we are not aiming to cover the merits of should you do this (if your application has high churn or millions of free users, for example, it might not be a good idea). Instead, we will focus on if the new data dictionary provides relief to a historical pain point.

Q: Why is one million tables a problem?

The main issue results from the fact that MySQL needs to open (and eventually close) the table structure file (FRM file). With one million tables, we are talking about at least one million files. Originally MySQL fixed it with table_open_cache and table_definition_cache. However, the maximum value for table_open_cache is 524288. In addition, it is split into 16 partitions by default (to reduce the contention). So it is not ideal. MySQL 8.0 has removed FRM files for InnoDB, and will now allow you to create general tablespaces. I’ve demonstrated how we can create tablespace per customer in MySQL 8.0, which is ideal for “schema-per-customer” approach (we can move/migrate one customer data to a new server by importing/exporting the tablespace).

One million tables in MySQL 5.7

Recently, I’ve created the test with one million tables. The test creates 10K databases, and each database contains 100 tables. To use a standard benchmark I’ve employed sysbench table structure.

This also creates a huge overhead: with one million tables we have ~two million files. Each .frm file and .ibd file size sums up to 175G:

Now I’ve used sysbench Lua script to insert one row randomly into one table

With:

Sysbench will choose one table randomly out of one million. With oltp_tables_count = 1 and oltp_db_count = 100, it will only choose the first table (sbtest1) out of the first 100 databases (randomly).

As expected, MySQL 5.7 has a huge performance degradation when going across one million tables. When running a script that only inserts data into 100 random tables, we can see ~150K transactions per second. When the data is inserted in one million tables (chosen randomly) performance drops to 2K (!) transactions per second:

Insert into 100 random tables:

Insert into one million random tables:

This is expected. Here I’m testing the worse case scenario, where we can’t keep all table open handlers and table definitions in cache (memory) since the table_open_cache and table_definition_cache both have a limit of 524288.

Also, normally we can expect a huge skew between access to the tables. There can be only 20% active customers (80-20 rule), meaning that we can only expect an active access to 2K databases. In addition, there will be old or unused tables so we can expect around 100K or less of active tables.

Hardware and config files

The above results are from this server:

Sysbench script:

My.cnf:

One million tables in MySQL 8.0 + general tablespaces

In MySQL 8.0 is it easy and logical to create one general tablespace per each schema (it will host all tables in this schema). In MySQL 5.7, general tablespaces are available – but there are still .frm files.

I’ve used the following script to create 100 tables in one schema all in one tablespace:

The new MySQL 8.0.3-rc also uses the new data dictionary, so all MyISAM tables in the mysql schema are removed and all metadata is stored in additional mysql.ibd file.

Creating one million tables

Creating InnoDB tables fast enough can be a task by itself. Stewart Smith published a blog post a while ago where he focused on optimizing time to create 30K tables in MySQL.

The problem is that after creating an .ibd file, MySQL needs to “fsync” it. However, when creating a table inside the tablespace, there is no fsync. I’ve created a simple script to create tables in parallel, one thread per database:

That script works perfectly in MySQL 8.0.1-dmr and creates one million tables in 25 minutes and 28 seconds (1528 seconds). That is ~654 tables per second. That is significantly faster than ~30 tables per second in the original Stewart’s test and 2x faster than a test where all fsyncs were artificially disabled using libeat-my-data library.

Unfortunately, in MySQL 8.0.3-rc some regression was introduced. In MySQL 8.0.3-rc I can see heavy mutex contention, and the table creation speed dropped from 25 minutes to ~280 minutes. I’ve filed a bug report: performance regression: “create table” speed and scalability in 8.0.3.

Size on disk

With general tablespaces and no .frm files, the size on disk decreased:

Please note though that in MySQL 8.0.3-rc, with new native data dictionary, the size on disk increased as it needs to write additional information (Serialized Dictionary Information, SDI) to the tablespace files:

The general mysql data dictionary in MySQL 8.0.3 is 6.6Gb:

Benchmarking the insert speed in MySQL 8.0 

I’ve repeated the same test I’ve done for MySQL 5.7 in MySQL 8.0.3-rc (and in 8.0.1-dmr), but using general tablespace. I created 10K databases (=10K tablespace files), each database has100 tables and each database resides in its own tablespace.

There are two new tablespace level caches we can use in MySQL 8.0: tablespace_definition_cache and schema_definition_cache:

Unfortunately, with one million random table accesses in MySQL 8.0 (both 8.0.1 and 8.0.3), we can still see that it stalls on opening tables (even with no .frm files and general tablespaces):

And the transactions per second drops to ~2K.

Here I’ve expected different behavior. With the .frm files gone and with tablespace_definition_cache set to more than 10K (we have only 10K tablespace files), I’ve expected that MySQL does not have to open and close files. It looks like this is not the case.

I can also see the table opening (since the server started):

This is easier to see on the graphs from PMM. Insert per second for the two runs (both running 16 threads):

  1. The first run is 10K random databases/tablespaces and one table (sysbench is choosing table#1 from a randomly chosen list of 10K databases). This way there is also no contention on the tablespace file.
  2. The second run is a randomly chosen table from a list of one million tables.

As we can see, the first run is dong 50K -100K inserts/second. Second run is only limited to ~2.5 inserts per second:

MySQL 8.0

“Table open cache misses” grows significantly after the start of the second benchmark run:
MySQL 8.0

As we can see, MySQL performs ~1.1K table definition openings per second and has ~2K table cache misses due to the overflow:

MySQL 8.0

When inserting against only 1K random tables (one specific table in a random database, that way we almost guarantee that one thread will always write to a different tablespace file), the table_open_cache got warmed up quickly. After a couple of seconds, the sysbench test starts showing > 100K tps. The processlist looks much better (compare the statement latency and lock latency to the above as well):

What about the 100K random tables? That should fit into the table_open_cache. At the same time, the default 16 table_open_cache_instances split 500K table_open_cache, so each bucket is only ~30K. To fix that, I’ve set table_open_cache_instances = 4 and was able to get ~50K tps average. However, the contention inside the table_open_cache seems to stall the queries:

MySQL 8.0

There are only a very limited amount of table openings:

MySQL 8.0

Conclusion

MySQL 8.0 general tablespaces looks very promising. It is finally possible to create one million tables in MySQL without the need to create two million files. Actually, MySQL 8 can handle many tables very well as long as table cache misses are kept to a minimum.

At the same time, the problem with “Opening tables” (worst case scenario test) still persists in MySQL 8.0.3-rc and limits the throughput. I expected to see that MySQL does not have to open/close the table structure file. I also hope the create table regression bug is fixed in the next MySQL 8.0 version.

I’ve not tested other new features in the new data dictionary in 8.0.3-rc: i.e., atomic DDL (InnoDB now supports atomic DDL, which ensures that DDL operations are either committed in their entirety or rolled back in case of an unplanned server stoppage). That is the topic of the next blog post.

PREVIOUS POST

Alexander Rubin

Alexander joined Percona in 2013. Alexander worked with MySQL since 2000 as DBA and Application Developer. Before joining Percona he was doing MySQL consulting as a principal consultant for over 7 years (started with MySQL AB in 2006, then Sun Microsystems and then Oracle). He helped many customers design large, scalable and highly available MySQL systems and optimize MySQL performance. Alexander also helped customers design Big Data stores with Apache Hadoop and related technologies.

MySQL and MariaDB Default Configuration Differences

$
0
0

Feed: Percona Database Performance Blog.
Author: Bradley Mickel.

 | October 9, 2017 | 
Posted In: InnoDB, Insight for DBAs, MariaDB, MySQL

PREVIOUS POST

MySQL and MariaDB Default ConfigurationIn this blog post, I’ll discuss some of the MySQL and MariaDB default configuration differences, focusing on MySQL 5.7 and MariaDB 10.2.

MariaDB Server is a general purpose open source database, created by the founders of MySQL. MariaDB Server (referred to as MariaDB for brevity) has similar roots as Percona Server for MySQL, but is quickly diverging from MySQL compatibility and growing on its own. MariaDB has become the default installation for several operating systems (such as Red Hat Enterprise Linux/CentOS/Fedora). Changes in the default variables can make a large difference in the out-of-box performance of the database, so knowing what is different is important.

As MariaDB grows on its own and doesn’t remain 100% compatible with MySQL, the defaults configuration settings might not mean everything or behave the way they used to. It might use different variable names, or implement the same variables in new ways. You also need to take into account that MariaDB uses it’s own Aria storage engine that has many configuration options that do not exist in MySQL.

Note: In this blog, I am looking at variables common to both MySQL or MariaDB, but have different defaults, not variables that are specific to either MySQL or MariaDB (except for the different switches inside the optimizer_switch).

Binary Logs

Variable MariaDB Default MySQL Default
sync_binlog 0 1
binlog_format Mixed Row

MySQL has taken a more conservative stance when it comes to the binary log. In the newest versions of MySQL 5.7, they have updated two variables to help ensure all committed data remains intact and identical. Binlog_format was updated to row in MySQL in order to prevent non-deterministic statements from having different results on the slave. Row-based replication also helps when performing a lot of smaller updates. MariaDB defaults to the Mixed format. Mixed uses statement-based format unless certain criteria are met. It hat case, it uses the row format. You can see the detailed criteria for when the row format is used here: https://mariadb.com/kb/en/the-mariadb-library/binary-log-formats/.

The other difference that can cause a significant impact on performance is related to sync_binlog. Sync_binlog controls the number of commit groups to collect before synchronizing the binary log to disk. MySQL has changed this to 1, which means that every transaction is flushed to disk before it is committed. This guarantees that there can never be a committed transaction that is not recorded (even during a system failure). This can create a big impact to performance, as shown by a Roel Van de Paar in his blog: https://www.percona.com/blog/2016/06/03/binary-logs-make-mysql-5-7-slower-than-5-6/

MariaDB utilizes a value of 0 for sync_binlog, which allows the operating system to determine when the binlog needs to be flushed. This provides better performance, but adds the risk that if MariaDB crashes (or power is lost) that some data may be lost.

MyISAM

Variable MariaDB Default MySQL Default
myisam_recover_options BACKUP,QUICK OFF
key_buffer_size 134217728 8388608

InnoDB replaced MyISAM as the default storage engine for some time now, but it is still used for many system tables. MySQL has tuned down the MyISAM settings, since it is not heavily used.

When mysqld opens a table, it checks whether the table is marked as crashed, or was not closed properly, and runs a check on it based on the myisam_recover_options settings. MySQL disables this by default, preventing recovery. MariaDB has enabled the BACKUP and QUICK recovery options. BACKUP causes a table_name-datetime.bak file to be created whenever a data file is changed during recovery. QUICK causes mysqld to not check the rows in a table if there are no delete blocks, ensuring recovery can occur faster.

MariaDB 10.2 increased the key_buffer_size. This allows for more index blocks to be stored in memory. All threads use this buffer, so a small buffer can cause information to get moved in and out of it more quickly. MariaDB 10.2 uses a buffer 16 times the size of MySQL 5.7: 134217728 in MariaDB 10.2 vsx 8388608 in MySQL 5.7.

Innodb

Variable MariaDB Default MySQL Default
innodb_max_undo_log_size 10485760(10 MiB) 1073741824(1024 MiB)

InnoDB variables have remained primarily unchanged between MariaDB 10.2 and MySQL 5.7. MariaDB has reduced the innodb_max_undo_log_size starting in 10.2.6. This was reduced from MySQL’s default of 1073741824(1024 MiB) to 10485760(10 MiB). These sizes reflect the maximum size an undo tablespace can become before it is marked for truncation. The tablespace doesn’t get truncated unless innodb_undo_log_truncate is enabled, and it is disabled in MySQL 5.7 and MariaDB 10.2 by default.

Logging

Variable MariaDB Default MySQL Default
log_error /var/log/mysqld.log
log_slow_admin_statements ON OFF
log_slow_slave_statements ON OFF
lc_messages_dir /usr/share/mysql

Logs are extremely important for troubleshooting any issues so the different choices in logging for MySQL 5.7 and MariaDB 10.2 are very interesting.

The log_error variable allows you to control where errors get logged. MariaDB 10.2 leaves this variable blank, writing all errors to stderr. MySQL 5.7 uses an explicitly created file at: /var/log/mysqld.log.

MariaDB 10.2 has also enabled additional slow statement logging. Log_slow_admin_statements create a record for any administrative statements that are not typically written to the binlog. Log_slow_slave_statements log the replicated statements sent from the master, if they are slow to complete. MySQL 5.7 does not enable logging of these statements by default.

Lc_messages_dir is the directory that contains the error message files for various languages. The variable defaults might be a little misleading in MariaDB 10.2. Lc_messages_dir is left empty by default, although it still uses the same path as MySQL 5.7. The files are located in /usr/share/mysql by default for both databases.

Performance Schema

Variable MariaDB Default MySQL Default
performance_schema OFF ON
performance_schema_setup_actors_size 100 -1 (auto adjusted)
performance_schema_setup_objects_size 100 -1 (auto adjusted)

The performance schema is an instrumentation tool that is designed to help troubleshoot various performance concerns. MySQL 5.7 enables the performance schema, and many of its instruments, by default. MySQL even goes so far as to detect the appropriate value for many Performance Schema variables instead of setting a static default. The Performance Schema does come with some overhead, and there are many blogs regarding how much this can impact performance. I think Sveta Smirnova said it best in her blog  Performance Schema Benchmarks OLTP RW: “…test on your system! No generic benchmark can exactly repeat a workload on your site.

MariaDB has disabled the Performance Schema by default, as well as adjusted a couple of the dynamic variables. Note that if you wish to disable or enable the Performance Schema, it requires a restart of the server since these variables are not dynamic. Performance_schema_setup_actors_size and performance_schema_setup_objects_size have both been set to a static 100, instead of the dynamic -1 used in MySQL 5.7. These both limit the number of rows that can be stored in relative tables. This creates a hard limit to the size these tables can grow to, helping to reduce their data footprint.

SSL/TLS

Variable MariaDB Default MySQL Default
ssl_ca ca.pem
ssl_cert server-cert.pem
ssl_key server-key.pem

Secure Sockets Layer (SSL) and Transport Layer Security (TLS) are cryptographic protocols that allow for secure communication. SSL is actually the predecessor of TLS, although both are often referred to as SSL. MySQL 5.7 and MariaDB 10.2 support both yaSSL and OpenSSL. The default configurations for SSL/TLS differ only slightly between MySQL 5.7 and MariaDB 10.2. MySQL 5.7 sets a specific file name for ssl_ca, ssl_cert, and ssl_key. These files are created in the base directory, identified by the variable basedir. Each of these variables is left blank in MariaDB 10.2, so you need to set them before using secure connections. These variables are not dynamic, so be sure to set the values before starting your database.

Query Optimizer

MariaDB 10.2 MySQL 5.7 Optimization Meaning Switch
N/A OFF Batched Key Access Controls use of BKA join algorithm batched_key_access
N/A ON Block Nested-Loop Controls use of BNL join algorithm block_nested_loop
N/A ON Condition Filtering Controls use of condition filtering condition_fanout_filter
Deprecated ON Engine Condition Pushdown Controls engine condition pushdown engine_condition_pushdown
ON N/A Engine Condition Pushdown Controls ability to push conditions down into non-mergeable views and derived tables condition_pushdown_for_derived
ON N/A Exists Subquery Allows conversion of in statements to exists statements exists_to_in
ON N/A Exists Subquery Allows conversion of exists statements to in statements in_to_exists
N/A ON Index Extensions Controls use of index extensions use_index_extensions
OFF N/A Index Merge Allows index_merge for non-equality conditions index_merge_sort_intersection
ON N/A Join Algorithms Perform index lookups for a batch of records from the join buffer join_cache_bka
ON N/A Join Algorithms Controls use of BNLH and BKAH algorithms join_cache_hashed
ON N/A Join Algorithms Controls use of incremental algorithms join_cache_incremental
ON N/A Join Algorithms Controls use of block-based algorithms for outer joins outer_join_with_cache
ON N/A Join Algorithms Controls block-based algorithms for use with semi-join operations semijoin_with_cache
OFF N/A Join Buffer Creates the join buffer with an estimated size based on the estimated number of rows in the result optimize_join_buffer_size
ON N/A Materialized Temporary Tables Allows index creation on derived temporary tables derived_keys
ON N/A Materialized Temporary Tables Controls use of the rowid-merge strategy partial_match_rowid_merge
ON N/A Materialized Temporary Tables Controls use of the partial_match_table-scan strategy partial_match_table_scan
OFF ON Multi-Range Read Controls use of the multi-range read strategy mrr
OFF ON Multi-Range Read Controls use of cost-based MRR, if mrr=on mrr_cost_based
OFF N/A Multi-Range Read Enables key ordered scans if mrr=on mrr_sort_keys
ON N/A Order By Considers multiple equalities when ordering results ordery_uses_equalities
ON N/A Query Plan Allows the optimizer to use hidden components of InnoDB keys extended_keys
ON N/A Query Plan Controls the removal of irrelevant tables from the execution plan table_elimination
ON N/A Subquery Stores subquery results and correlation parameters for reuse subquery_cache
N/A ON Subquery Materialization Controls us of cost-based materialization ubquery_materialization_cost_based
N/A ON Subquery Materialization &

Semi-join

Controls the semi-join duplicate weedout strategy duplicateweedout

The query optimizer has several variances that not only affect query performance but also how you write SQL statements. The query optimizer is substantially different between MariaDB and MySQL, so even with identical configurations you are likely to see varying performance.

The sql_mode puts restrictions on how you can write queries. MySQL 5.7 has several additional restrictions compared to MariaDB 10.2. Only_full_group_by requires that all fields in any select…group by statement are either aggregated or inside the group by clause. The optimizer doesn’t assume anything regarding the grouping, so you must specify it explicitly.

No_zero_date, and no_zero_in_date both affect how the server interprets 0’s in dates. When no_zero_date is enabled, values of ‘0000-00-00’ are permitted but produce a warning. With strict mode enabled, then the value is not permitted and produces an error. No_zero_in_date is similar, except it applies to any section of the date(month, day, or year). With this disabled, dates with 0 parts, such as ‘2017-00-16’ are allowed as is. When enabled, the date is changed to ‘0000-00-00’ without warning. Strict mode prevents the date being inserted, unless ignore is provided as well. “INSERT IGNORE” and “UPDATE IGNORE” inserts the dates as ‘0000-00-00’. 5.7.4 changed this. No_zero_in_date was consolidated with strict mode, and the explicit option is deprecated.

The query_prealloc_size determines the size of the persistent buffer used for statement parsing and execution. If you regularly use complex queries, it can be useful to increase the size of this buffer, as it does not need to allocate additional memory during the query parsing. MySQL 5.7 has set this buffer to 8192, with a block size of 1024. MariaDB increased this value in 10.1.2 up to 24576.

Query_alloc_block_size dictates the size in bytes of any extra blocks allocated during query parsing. If memory fragmentation is a common problem, you might want to look at increasing this value. MySQL 5.7 uses 8192, while MariaDB 10.2 uses 16384 (twice that). Be careful when adjusting the block sizes: going too high consumes more than the needed amount of memory, and too low causes significant fragmentation.

The optimizer_switch variable contains many different switches that impact how the query optimizer plans and performs different queries. MariaDB 10.2 and MySQL 5.7 have many differences in their enabled options, and even the available options. You can see a brief breakdown of each of the options below. Any options with N/A is not supported in that server.

Miscellaneous

Variable MariaDB Default MySQL Default
default_tmp_storage_engine NULL InnoDB
group_concat_max_len 1048576(1M) 1024(1K)
Lock_wait_timeout 86400 (1 DAY) 31536000 (1 YEAR)
Max_allowed_packet (16777216) 16MB 4194304 (4MB)
Max_write_lock_count 4294967295 18446744073709551615
Old_passwords OFF 0
Open_files_limit 0 dependent on OS
pid_file /var/lib/mysql/ /var/run/mysqld/
secure_file_priv Varies by installation
sort_buffer_size 2097152 262144
table_definition_cache 400 autosized
table_open_cache_instances 8 16
thread_cache_size autosized autosized
thread_stack 292KB 192KB/256KB

There are many variables that do not fit well into a group. I will go over those here.

When creating temporary tables, if you do not specify a storage engine then a default is used. In MySQL 5.7 this is set to InnoDB, the same as the default_storage_engine. MariaDB 10.2 also uses InnoDB, but it is not explicitly set. MariaDB sets the default_tmp_storage_engine to NULL, which causes it to use the default_storage_engine. This is important to remember if you change your default storage engine, as it would also change the default for temporary tables. An Important note, in MariaDB this is only relevant to tables created with “CREATE TEMPORARY TABLE”. Internal in-memory temporary tables use the memory storage engine, and internal, on-disk temporary tables use the aria engine by default.

The Group_concat function can cause some very large results if left unchecked. You can restrict the maximum size of results from this function with group_concat_max_len. MySQL 5.7 limits this to 1024(1K). MariaDB increased the value in 10.2.4 up to 1048576(1M).

Lock_wait_timeout controls how long a thread waits as it attempts to acquire a metadata lock. Several statements require a metadata lock, including DDL and DML operations, Lock Tables, Flush Tables with Read Lock and Handler statements. MySQL 5.7 defaults to the maximum possible value (one year), while MariaDB 10.2 has toned this down to one day.

Max_allowed_packet sets a limit to the maximum size of a packet, or a generated/intermediate string. This value is intentionally kept small (4MB) on MySQL 5.7 in order to detect the larger, intentionally incorrect packets. MariaDB has increased this value to 16MB. If using any large BLOB fields, you need to adjust this value to the size of the largest BLOB, in multiples of 1024, or you risk running into errors transferring the results.

Max_write_lock_count controls the number of write locks that can be given before some read lock requests being processed. In extremely heavy write loads your reads can pile up while waiting for the writes to complete. Modifying the max_write_lock_count allows you to tune how many writes can occur before some reads are allowed against the table. MySQL 5.7 keeps this value at the maximum (18446744073709551615), while MariaDB 10.2 lowered this to 4294967295. One thing to note is that this is still the maximum value on MariaDB 10.2.

Old_passwords controls the hashing method used by the password function, create user and grant statements. This variable has undergone several changes in MySQL 5.7. As of 5.7.4 the valid options were MySQL 4.1 native hashing, Pre-4.1 (old) hashing, and SHA-256 hashing. Version 5.7.5 removed the “old” Pre-4.1 method, and in 5.7.6 the variable has been deprecated with the intent of removing it entirely. MariaDB 10.2 uses a simple boolean value for this variable instead of the enumerated one in MySQL 5.7, though the intent is the same. Both default the old_passwords to OFF, or 0, and allow you to enable the older method if necessary.

Open_files_limit restricts the number of file descriptors mysqld can reserve. If set to 0 (the default in MariaDB 10.2) then mysqld reserves max_connections * 5 or max_connections + table_open_cache * 2, whichever is larger. It should be noted that mysqld cannot use an amount larger than the hard limit imposed by the operating system. MySQL 5.7 is also restricted by the operating systems hard limit, but is set at runtime to the real value permitted by the system (not a calculated value).

The pid_file allows you to control where you store the process id file. This isn’t a file you typically need, but it is good to know where it is located in case some unusual errors occur. On MariaDB you can find this inside /var/lib/mysql/, while on MySQL 5.7 you will find it inside /var/run/mysqld/. You will also notice a difference in the actual name of the file. MariaDB 10.2 uses the hostname as the name of the pid, while MySQL 5.7 simply uses the process name (mysqld.pid).

Secure_file_priv is a security feature that allows you to restrict the location of files used in data import and export operations. When this variable is empty, which was the default in MySQL before 5.7.6, there is no restriction. If the value is set to NULL, import and export operations are not permitted. The only other valid value is the directory path where files can be imported from or exported to. MariaDB 10.2 defaults to empty. As of MySQL 5.7.6, the default will depend on the install_layout CMAKE option.

INSTALL_LAYOUT DEFAULT VALUE
STANDALONE,WIN NULL(>=MySQL 5.7.16_,empty(
DEB,RPM,SLES,SVR4 /var/lib/mysql-files
Other Mysql-files under the CMAKE_INSTALL_PREFIX value

Mysqld uses a sort buffer regardless of storage engine. Every session that must perform a sort allocates a buffer equal to the value of sort_buffer_size. This buffer should at minimum be large enough to contain 15 tuples. In MySQL 5.7, this defaults to 262144, while MariaDB 10.2 uses the larger value 2097152.

The table_definition_cache restricts the number of table definitions that can be cached. If you have a large number of tables, mysqld may have to read the .frm file to get this information. MySQL 5.7 auto detects the appropriate size to use, while MariaDB 10.2 defaults this value to 400. On my small test VM, MySQL 5.7 chose a value of 1400.

The table_open_cache_instances vary in implementation between MySQL and MariaDB. MySQL 5.7 creates multiple instances of the table_open_cache, each holding a portion of the tables. This helps reduce contention, as a session needs to lock only one instance of the cache for DML statements. In MySQL 5.7.7 the default was a single instance, but this was changed in MySQL 5.7.8 (increased to 16). MariaDB has a more dynamic approach to the table_open_cache. Initially there is only a single instance of the cache, and the table_open_cache_instances variable is the maximum number of instances that can be created. If contention is detected on the single cache, another instance is created and an error logged. MariaDB 10.2 suspects that the maximum eight instances it sets by default should support up to 100 CPU cores.

The thread_cache_size controls when a new thread is created. When a client disconnects the thread is stored in the cache, as long as the maximum number of threads do not exist. Although this is not typically noticeable, if your server sees hundreds of connections per second you should increase this value to so that new connections can use the cache. Thread_cache_size is an automatically detected variable in both MySQL 5.7 and MariaDB 10.2, but their methods to calculate the default vary significantly. MySQL uses a formula, with a maximum of 100: 8+ (max_connections / 100). MariaDB 10.2 uses the smaller value out of 256 or the max_connections size.

The thread_stack is the stack size for each thread. If the stack size is too small, it limits the complexity of SQL statements, the recursion depth of stored procedures and other memory-consuming actions. MySQL 5.7 defaults the stack size to 192KB on 32-bit platforms and 256KB on 64-bit systems. MariaDB 10.2 adjusted this value several times. MariaDB 10.2.0 used 290KB, 10.2.1 used 291KB and 10.2.5 used 292KB.

Conclusion

Hopefully, this helps you with the configurations options between MySQL and MariaDB. Use the comments for any questions.

PREVIOUS POST


Creating an Application Load Balancer and querying it’s logging data using Athena

$
0
0

Feed: Planet big data.
Author: Praveen Sripati.

When building a highly scalable website like amazon.com, there would be thousands of web servers and all of them would be fronted by multiple load balancers as shown below. The end user would be pointing to the load balancer which would forward the requests to the web servers. In the case of the AWS ELB (Elastic Load Balancer), the distribution of the traffic from load balancer to the servers is in a round-robin fashion and doesn’t consider the size of the server or how busy/idle the servers are. May be AWS will add this feature in the upcoming releases.

In this blog, we would be analyzing the number of users coming to a website
from different ip addresses. Here are the steps at a high level which we
would be exploring in a bit more detail. This is again a lengthy post where would be using a couple of AWS services (ELB, EC2, S3 and  Athena) and see how they work together.
   
    – Create two Linux EC2 instance with web servers with different content
    – Create an Application Load Balancer and forward the requests to the above web servers
    – Enable the logging on the Application Load Balancer to S3
    – Analyze the logging data using Athena

To continue further, the following can be done (not covered in this article)

    – Create a Lambda function to call the Athena query at regular intervals
    – Auto Scale the EC2 instances depending on the resource utilization
    – Remove the Load Balancer data from s3 after a certain duration

Step 1: Create two Linux instances and install web servers as mentioned in this blog. In the /var/www/html folder have the files as mentioned below. Ports 22 and 80 have to be opened for accessing the instance through ssh and for accessing the web pages in the browser.

     server1 – index.html
     server2 – index.hml and img/someimage.png

Make sure that ip-server1, ip-server2 and ip-server2/img/someimage.png are accessible from the web browser. Note that the image should be present in the img folder. The index.html is for serving the web pages and also for the health check, while the image is for serving the web pages.

Step 2: Create the Target Group.

Step 3: Attach the EC2 instances to the Target Group.

Step 4: Change the Target Group’s health checks. This will make the instances healthy faster.

Step 5: Create the second Target Group. Associate server2 with the target-group2 as mentioned in the flow diagram.

Step 6: Now is the time to create the Application Load Balancer. This balancer is relatively new when compared to the Classic Load Balancer. Here is there difference between the different Load Balancers. The Application Load Balancer operates at the layer 7 of the OSI and supports host-based and path-based routing. Any web requests with ‘/img/*’ pattern would be sent to the target-group2, rest by default would be sent to target-group1 after completing the below settings.

Step 7: Associate the target-group1 with the Load Balancer, the target-group2 will be associated later.

Step 8: Enable access logs on the Load Balancer by editing the attributes. The specified S3 bucket for storing the logs will be automatically created.

Few minutes after the Load Balancer has been created, the instances should turn into a healthy state as shown below. If not, then maybe one of the above steps has been missed.

Step 9: Get the DNS name of the Load Balancer and open it in the browser to make sure that the Load Balancer is working.

Step 10: Now is the time to associate the second Target Group (target-group2). Click on View/edit rules) and add a rule.

Any requests with the path /img/* would be sent to the target-group2, rest of them would be redirected to the target-group2.

Step 11: Once the Load Balancer has been accessed from different browsers a couple of times, the log files should be generated in S3 as shown below.

Step 12: Now it’s time to create tables in Athena and then map it to the data in S3 and query the tables. The DDL and the DML commands for Athena can be found here.

We have seen how to create a Load Balancer, associate Linux web servers with them and finally check how to query the log data with Athena. Make sure that all the AWS resources which have been created are deleted to stop the billing for them.

That’s it for now.

Viewing all 275 articles
Browse latest View live